As the financial services industry has scrambled to address the latest regulatory challenge and embed climate risks top-down and bottom-up, UK firms are having to quickly understand an entirely new discipline – climate change – a feat that has taken some academics an entire lifetime.
Being a financial professional myself and having worked closely with those academics for the past two years, here are 10 things you should really consider when employing climate data.
1. Hazard Library
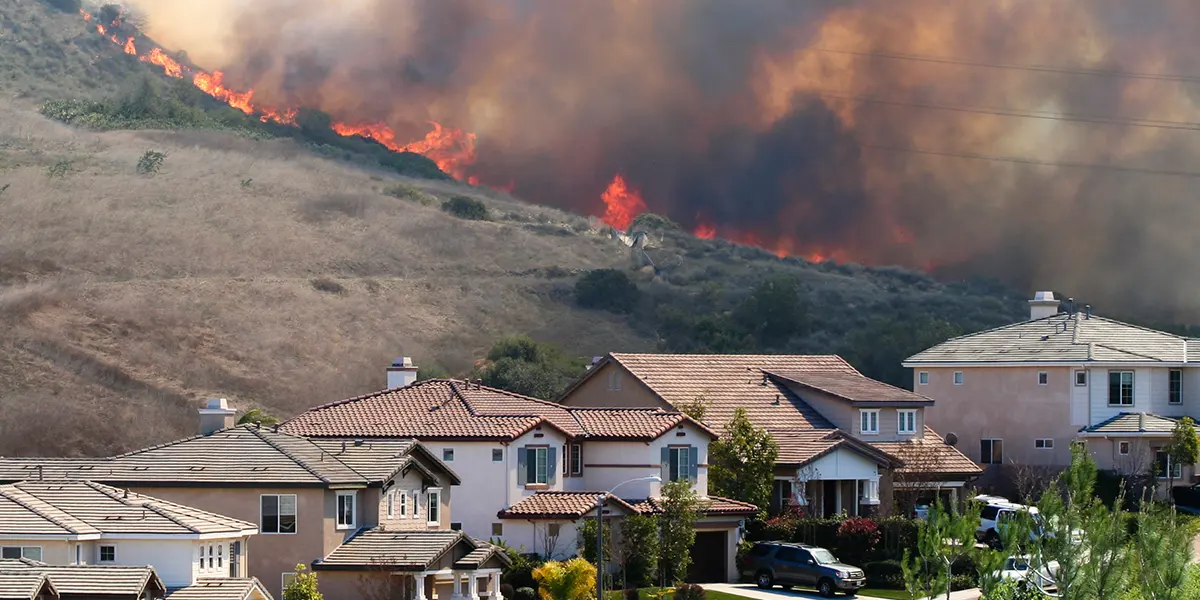
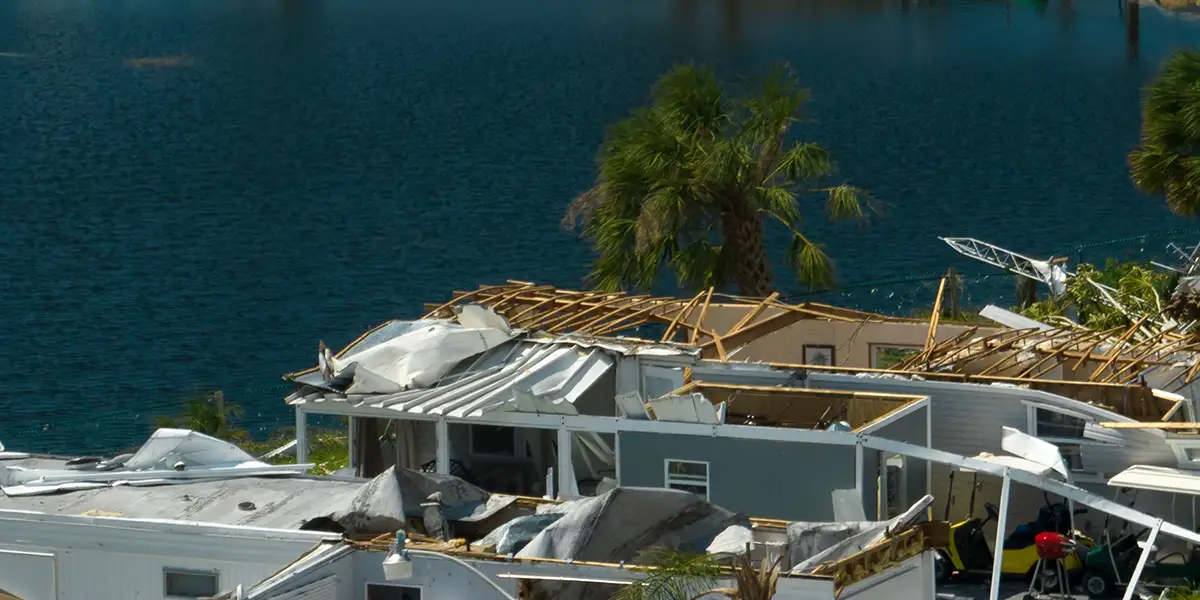
Flooding is not the only climate risk the UK should worry about, and firms hoping they met SS3/19 requirements set by the regulators with a simple flooding assessment might be in for a surprise. It’s true that flooding tops the charts. Just under 30% of all home insurance claims exist due to usually dry areas being inundated, but other weather-related claims (mainly storms) and subsidence claims total 17%. That’s a significant number and, unluckily for some firms, the ‘secondary’ hazards tend to be heavily concentrated, e.g., along the coast and London/East of England for storms and subsidence respectively.
2. Vulnerablity
Hazards alone can be meaningless if lacking context. A 1-metre-deep flood for a 19th century building will be typically more devastating than a 1-meter-deep flood for a new build. IPCC and CFRF prescribe that firms should understand not only the hazards but also assets’ vulnerabilities, e.g., age, what materials they are built from, whether they’re residential, commercial, multi-storey etc. Finally, to draw a true comparison across a portfolio you’d derive losses from those inputs and express them as a percentage of building replacement costs in a given area.
3. Validation
Do ask for validation metrics and validation documentation. For example, to validate flooding in the UK alone, one may have to scrutinise England & Wales, Scotland and Northern Ireland separately due to varying levels of data quality or availability across the regions. Some data firms get away with running limited validation or none - the simple reason being any validation takes much longer than an actual hazard model run and requires a solid understanding of the problem. The more time spent validating and benchmarking the models, the more confidence you can have in the data.
4. Method
Don’t be amazed by machine learning. Many climate-related hazards are best modelled by directly simulating the physical processes. While physics-based methods are typically more complex than a purely statistical (machine learning) approach, they have far greater interpretability as they realistically emulate the forces of nature. Machine learning has its application though: when the physical system becomes too complex to describe with the laws of physics and limited computing power, or to fill the gaps in missing model inputs.
5. Resolution
Is a model with 90-meter inputs interpolated to 10-meter squares still a 10-meter model – given an interpolation is just a fancy word for slicing the large square into 9x9 smaller squares? Asset-level intelligence means A LOT of granular data inputs, this can be both expensive to acquire and process or simply not available. Due caution is needed when looking at the uber ‘granularity’ claims made in the market as the resolution of input data is likely much lower (made from slicing larger grids).
High-resolution impact models might also not make sense due to large-scale geophysical events causing them. Take subsidence as an example – geohazards are heavily dependent on underlying rocks and soil, and those do not ‘change’ every 10 metres. Anyone claiming to have modelled subsidence at 10 metres resolution would have at least modelled every single tree adjacent to an asset and potentially manually measured the impact such trees would have on subsidence on properties across the whole country - which doesn’t sound likely or easy to do.
6. Use case options
One set of climate data outputs won’t satisfy each part of the business. For stress testing, regulators have been quite clear on climate risk associated with the severity events occurring once every 100 years. However, if you’re an asset manager and have the ability to reshape your balance sheet quickly, 1in10 year event severity risk assessment might well be more appropriate.
Similarly, with an average mortgage lifetime of 25 years, combining the RCP8.5 scenario (maximum emissions) and 1in100 year events are potentially doubling up on the stress as part of the origination process. This is where firms need a variety of options to choose from to suit their respective departments better.
7. Team and advisors
Look out for the composition of teams building out the data. Are they mainly engineering? How many scientists are involved? Climate risk is a complex and inter-disciplinary problem. Specialisms and domain expertise are required to truly cover a variety of hazards – a storm scientist won’t typically know hydrology and vice versa; a data engineer even less so.
But the strong science and engineering teams alone don’t guarantee the data will be fit for purpose. Distilling the science complexity into an actionable, finance-focussed intelligence does merit specific expertise- those with risk/credit risk or underwriting experience.
8. Scoring
Countless rating and scoring systems are now available in the market for climate data: from sensitivity metrics all the way up to 1-100 indices. That said, major environmental bodies like DEFRA or the UK Met Office already use established and internationally agreed rating scales. Those rating scales require certain types of data to work, namely probability and severity of respective hazards, and when firms can’t produce them, sometimes they become more creative with their scoring system.
9. Coverage
In modern-day finance, collateral can have many different forms. The most common type of collateral is real estate: either residential or commercial. However, agricultural fields, machinery or even SME director assets should be climate-assessed too. Whilst climate-adjusted losses might not always be possible to calculate for specialist lending, as a minimum, a country-wide coverage of natural hazards is expected.
10. Climate downscaling
Here’s some controversy. Whilst asset-level hazard models can be a reality, any temperature and rainfall across the entire UK with a resolution or grid size smaller than 2km are currently simply a mere approximation. Why? They’d be using statistical downscaling meaning past trends and weather patterns, or even basic interpolation, are used to inform the extrema in a downscaled grid. Climate, however, is non-linear and non-stationary; hence the past is not always a good indication of the future. To generate small scale weather information in a scientifically valid fashion, dynamical downscaling is needed. Since this process relies effectively on running your own climate model, to cover a whole country until 2100 and with a high resolution would take an enormous processing power beyond most cloud resources and time. The UK Met Office built their latest UKCP18 climate projections over a couple of years and only a fraction of variables from only one scenario are this granular. That was also a multi-million-pound supercomputer-requiring project.


