
This week we’ve seen some stunning images released by the James Webb Space Telescope (JWST), but did you also see the spectra?
WHAT IS THE JWST?
JWST sits 1,000,000 miles away from Earth (at the second Lagrangian point), operating at near absolute zero temperature, gazing into space and capturing light from distant celestial objects. The light is recorded with 1 of 4 instruments (remote sensing devices) - depending on which instrument is currently doing the recording, this can make images or spectra.
Spectroscopy involves splitting light from a distant object into its component colours – think about shining a white light onto a prism and seeing the rainbow coming out the other side. By looking at the colours which come out of the prism, and how bright or faint each colour is, we can tell things about the chemical composition of the thing that emitted the light. One of the first JWST ‘pictures’ is a spectrum of the atmosphere of a distant planet – we can now say the JWST has detected water in the clouds of a planet orbiting another star!
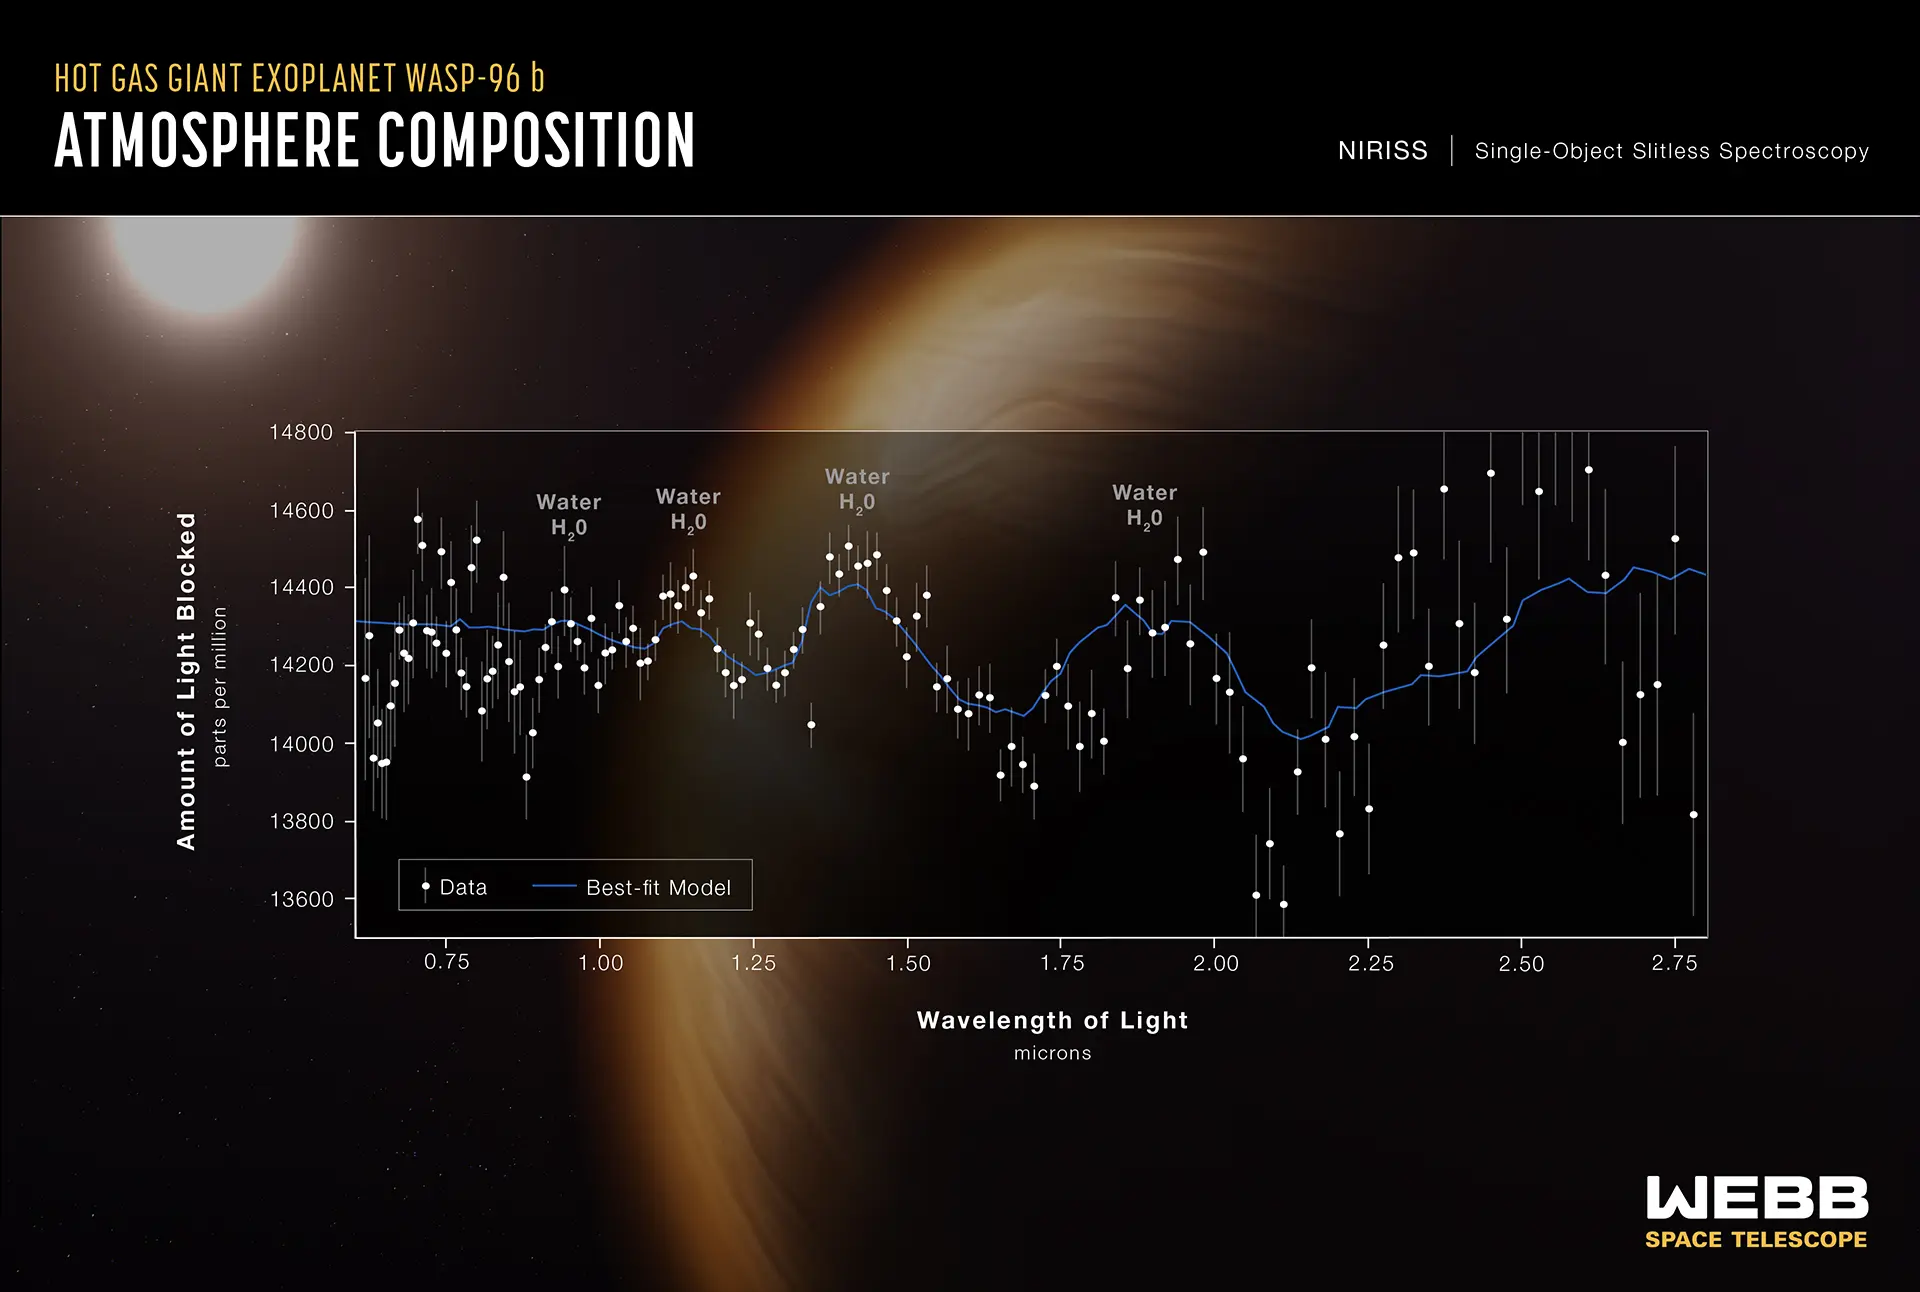
The first spectroscopic data released from JWST. The x-axis (left to right) shows colour with redness increasing as you go further right (as measured by the electromagnetic wavelength of the light). The y axis (up and down) shows the increasing brightness of the colour measured. The light from a distant star shines through the atmosphere of the planet – some colours of light are absorbed, and some pass straight through and make it to the JWST. The peaks in the spectra show characteristic infrared colour combinations that indicate water.
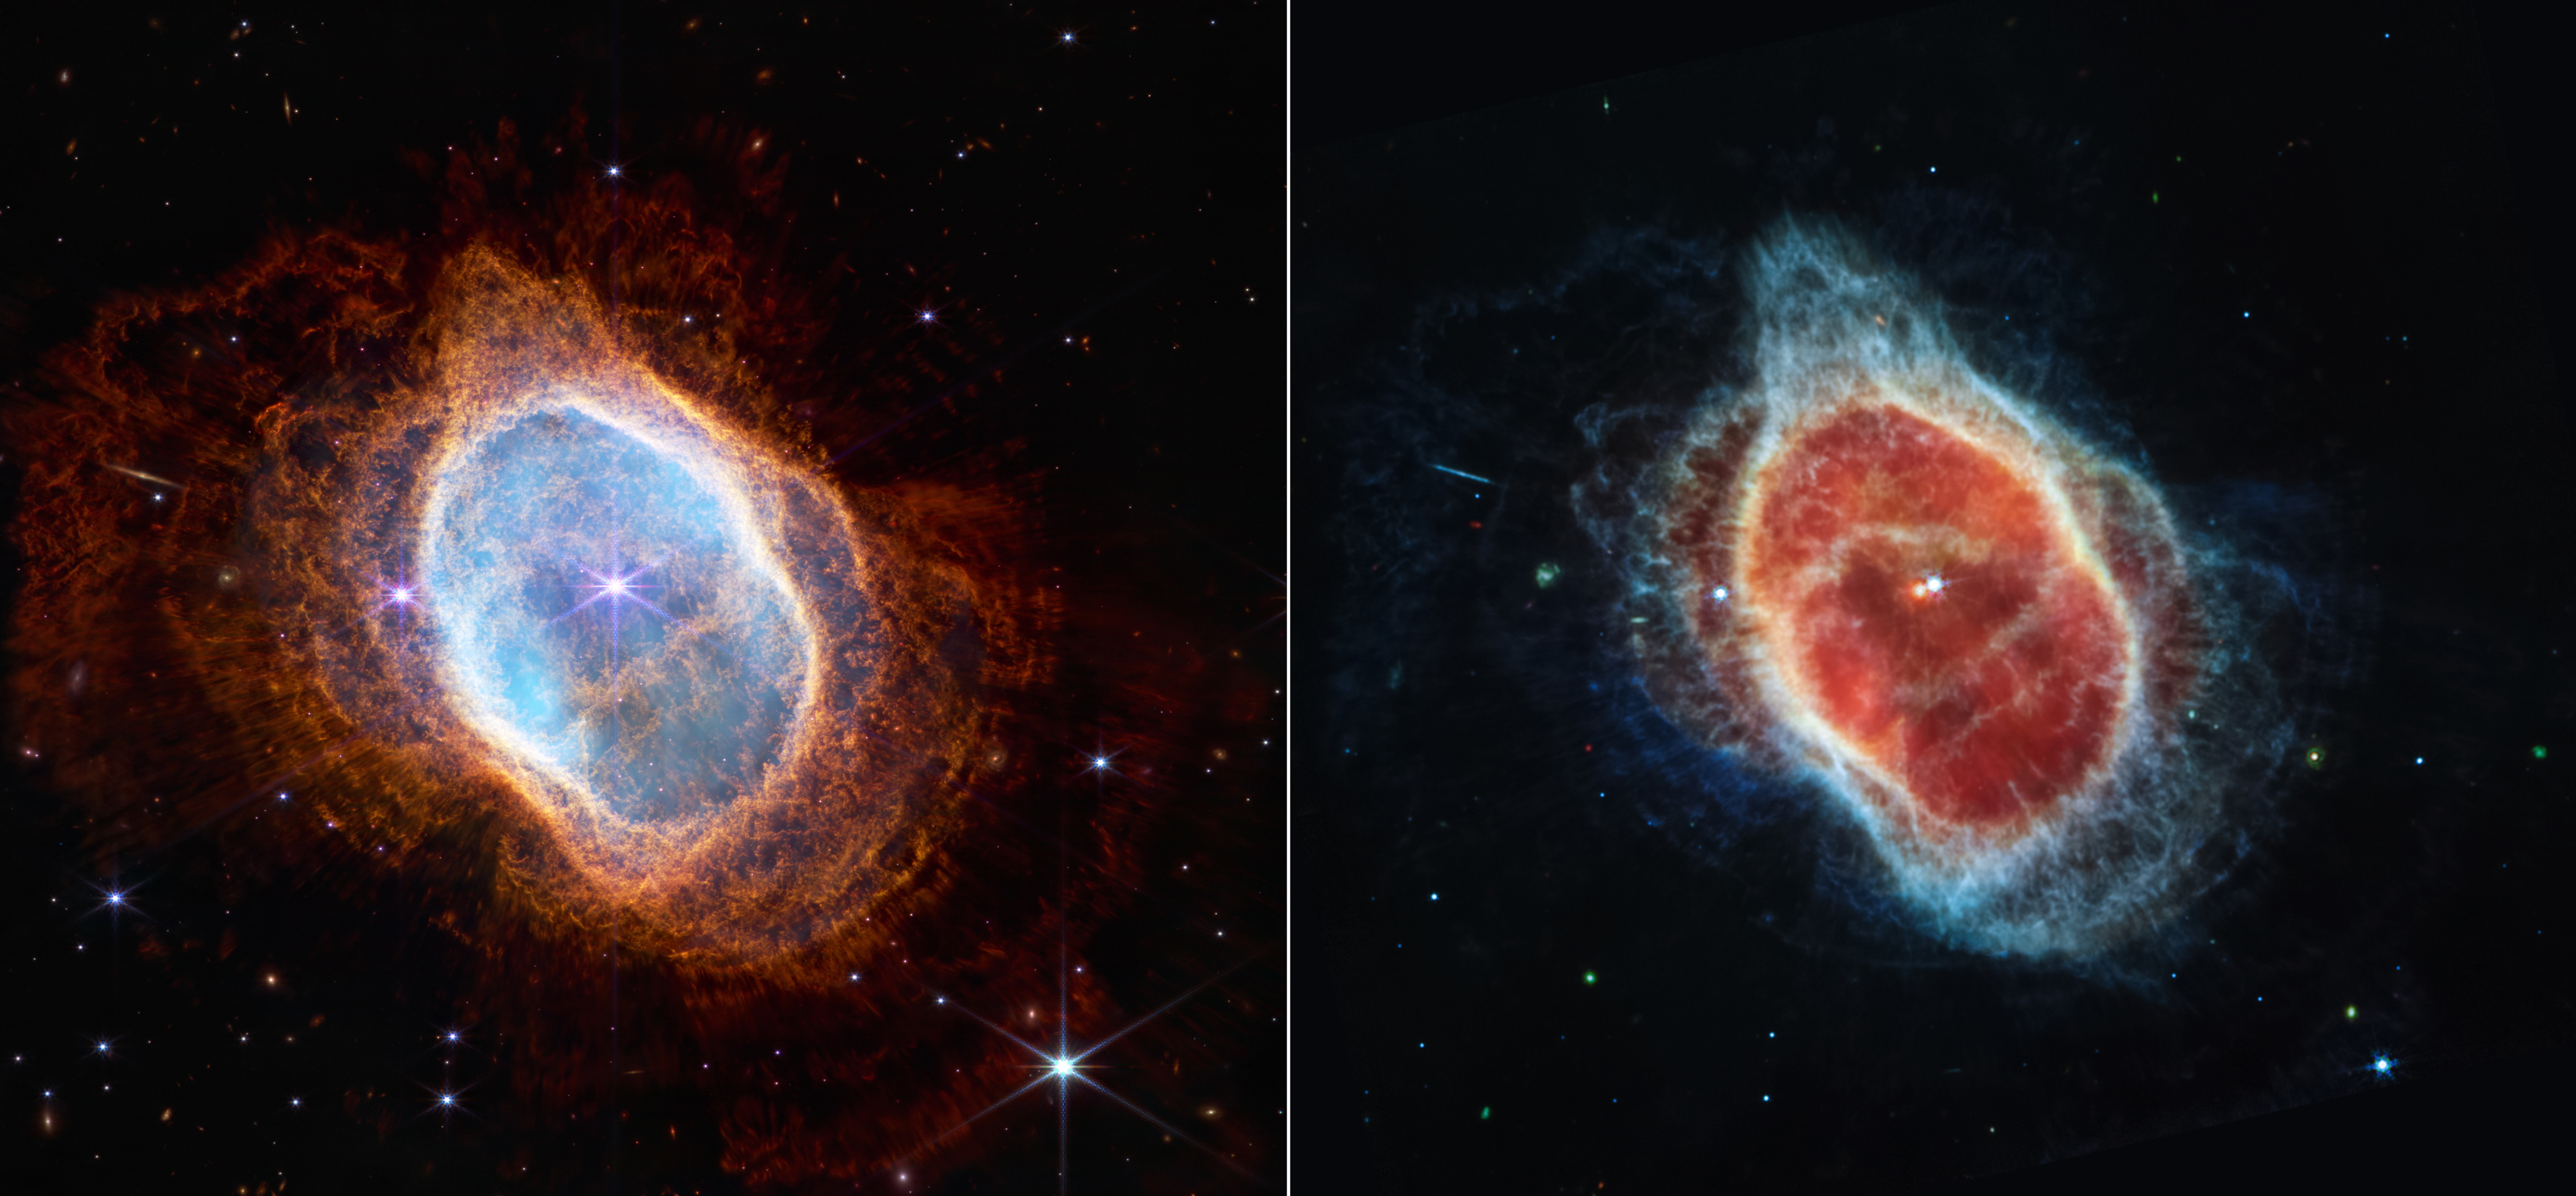
The spectroscopic fun doesn’t stop there! JWST has 2 imaging sensors, each of which can see a different colour of light. JWST almost entirely looks at infrared light – this is light which is redder than our eyes can see. We are interested in the red part of the electromagnetic spectrum when looking out into space because the further away we look in space the redder objects in the Universe appear (the redshift effect caused by the expanding Universe).
By looking at the difference between the two different infrared images, we can also see how different chemicals are distributed in distant celestial objects like galaxies or star-forming clouds – shedding light on how our planet was made, or how the first stars were born. We can also combine these different images together to produce the marvellous colour photos we have seen this week.
DOWN TO EARTH
So, why are we, a climate risk data provider, talking about photos from space on our blog? Well, our product is called Spectra for a reason. We gather images from remote sensors on satellites, some of which are infrared, some of which is in the colours we can see with our eyes.
We combine it all to build maps that let us understand environments closer to home. Then we add the laws of physics to simulate how climate-related physical disasters could impact our cities and infrastructure. Our remote sensing data and models allow us to see and understand things that we can’t distinguish so easily with our eyes.
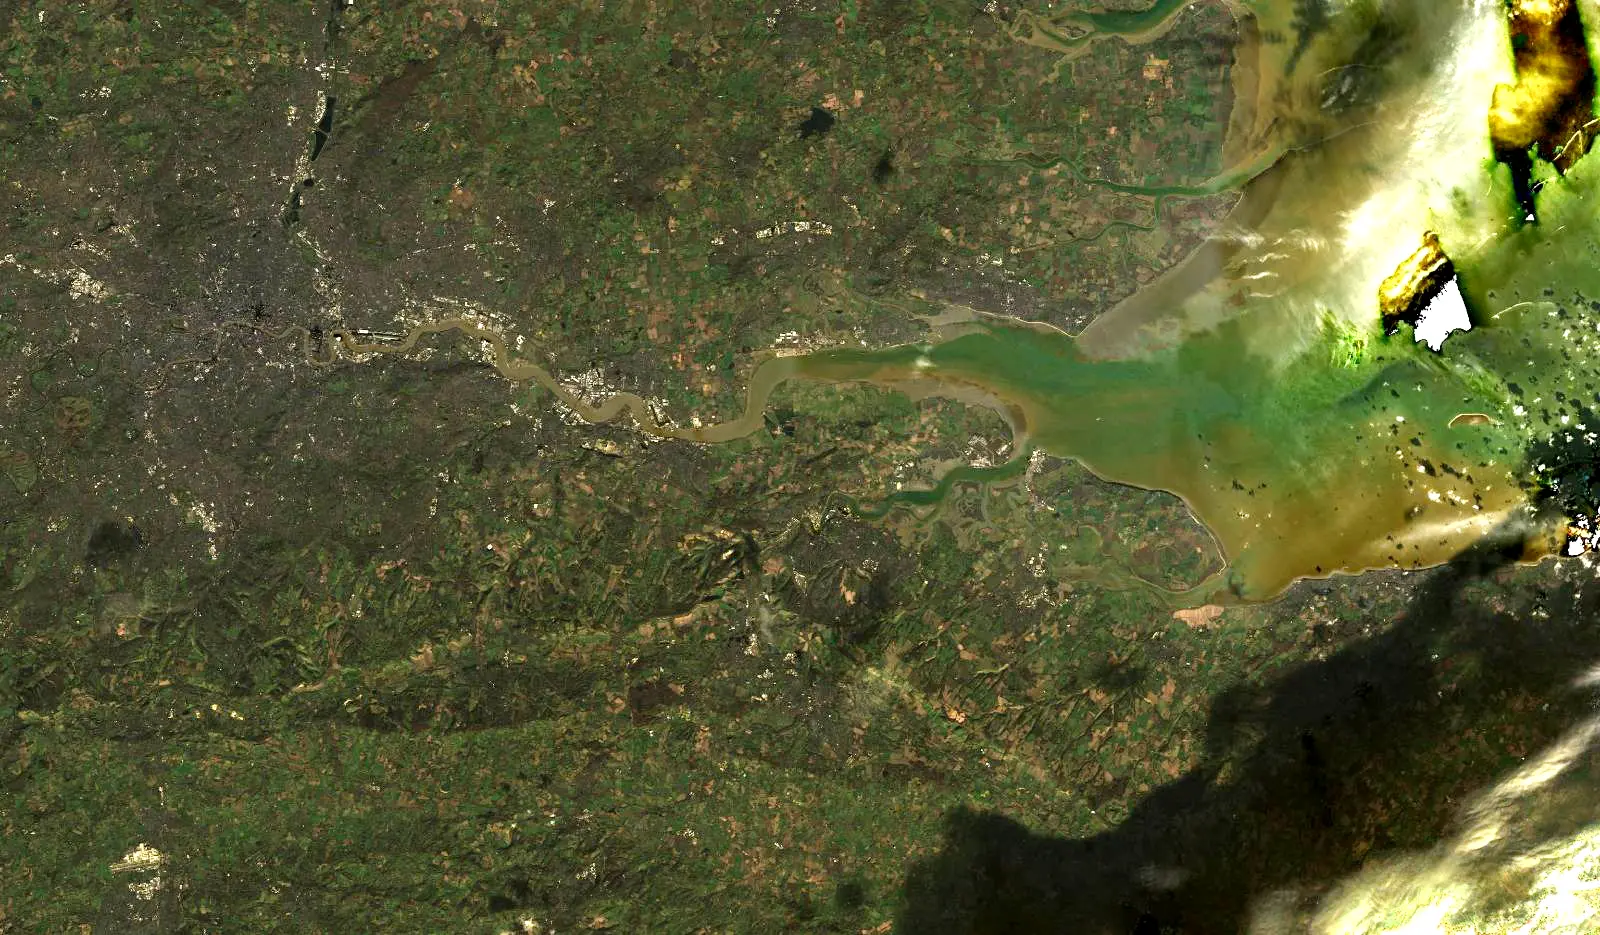
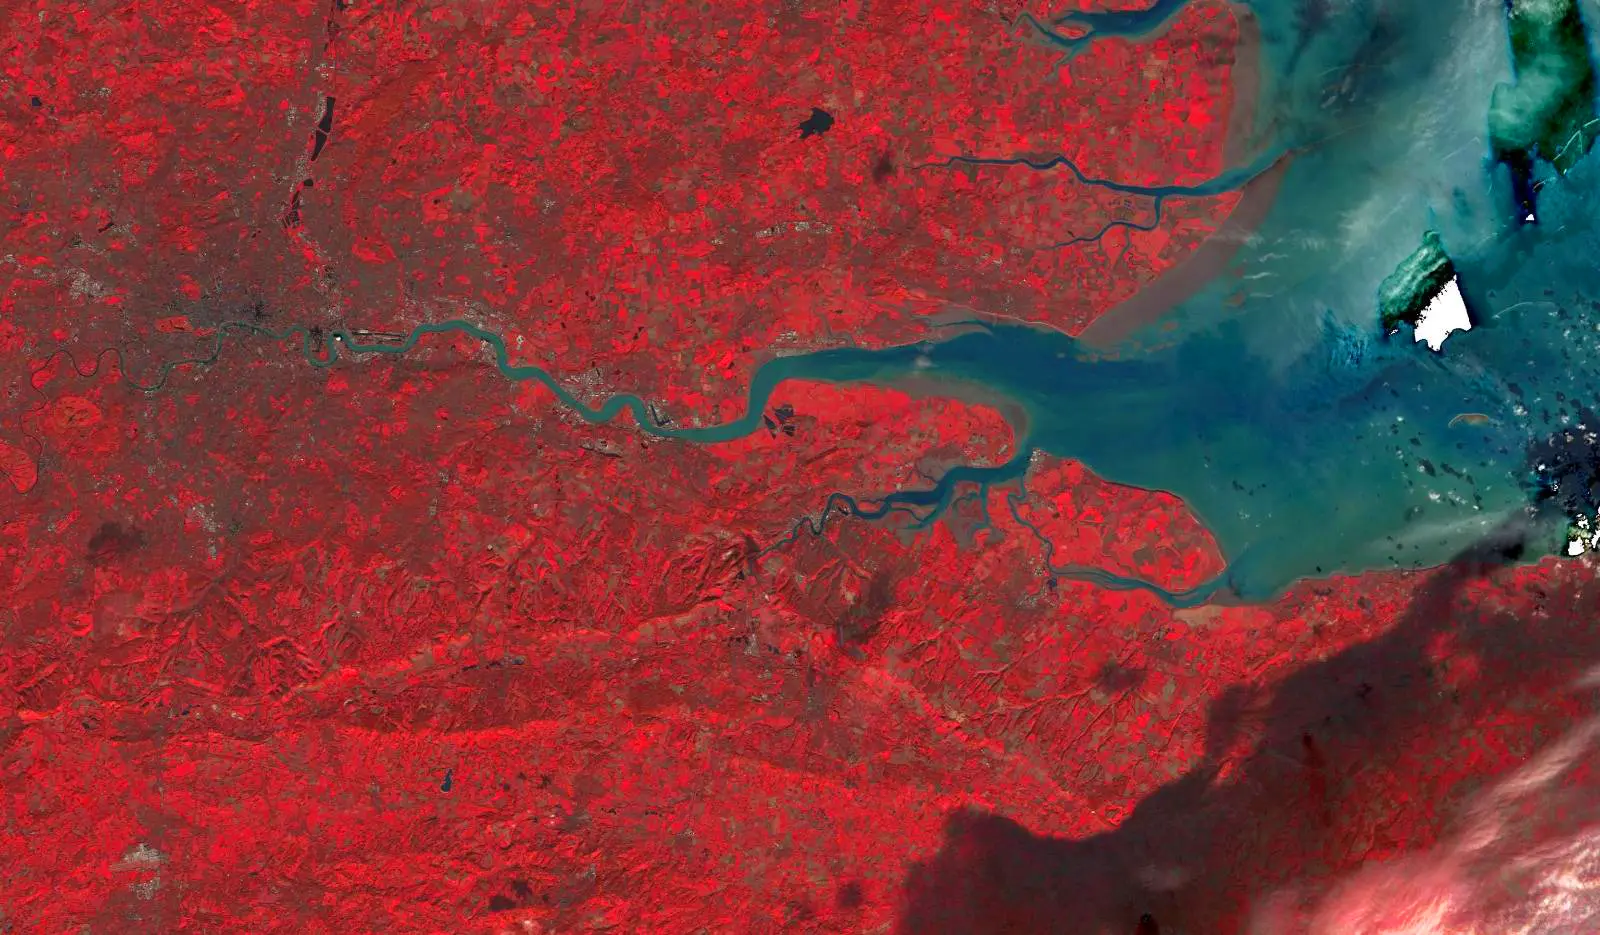
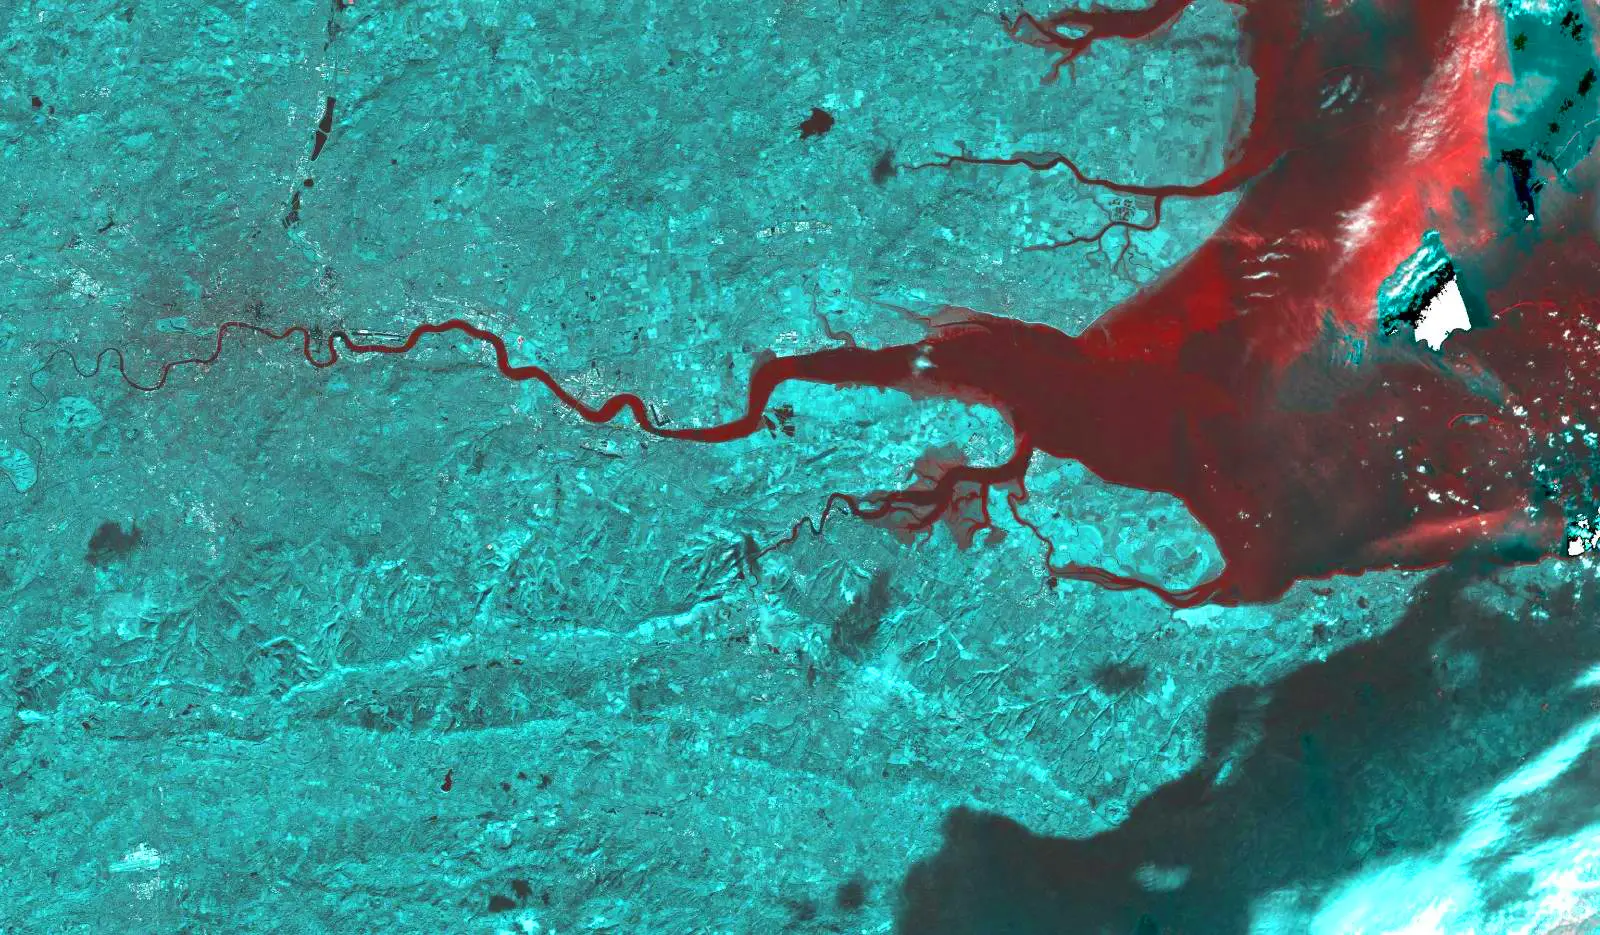
Image 1: visible light - the land as you would see with your eyes.
Image 2: near-infrared - just a bit redder than your eyes can see. Vegetation reflects this colour of light very strongly and appears bright red in this image. The fields that look dark in this image are bare.
Image 3: short-wave infrared - a bit redder than the near-infrared, the sediment in water reflects a lot of this light, so the water appears brightest red in this image.
We love to take inspiration from varied fields in our scientific analysis; it helps uncover new insights that nobody has ever thought of before or answer unsolved questions. I should know; I started my career with a PhD in astrophysics and have since used astrophysical techniques to understand extreme weather and to automatically detect rhinos on the plains of South Africa!
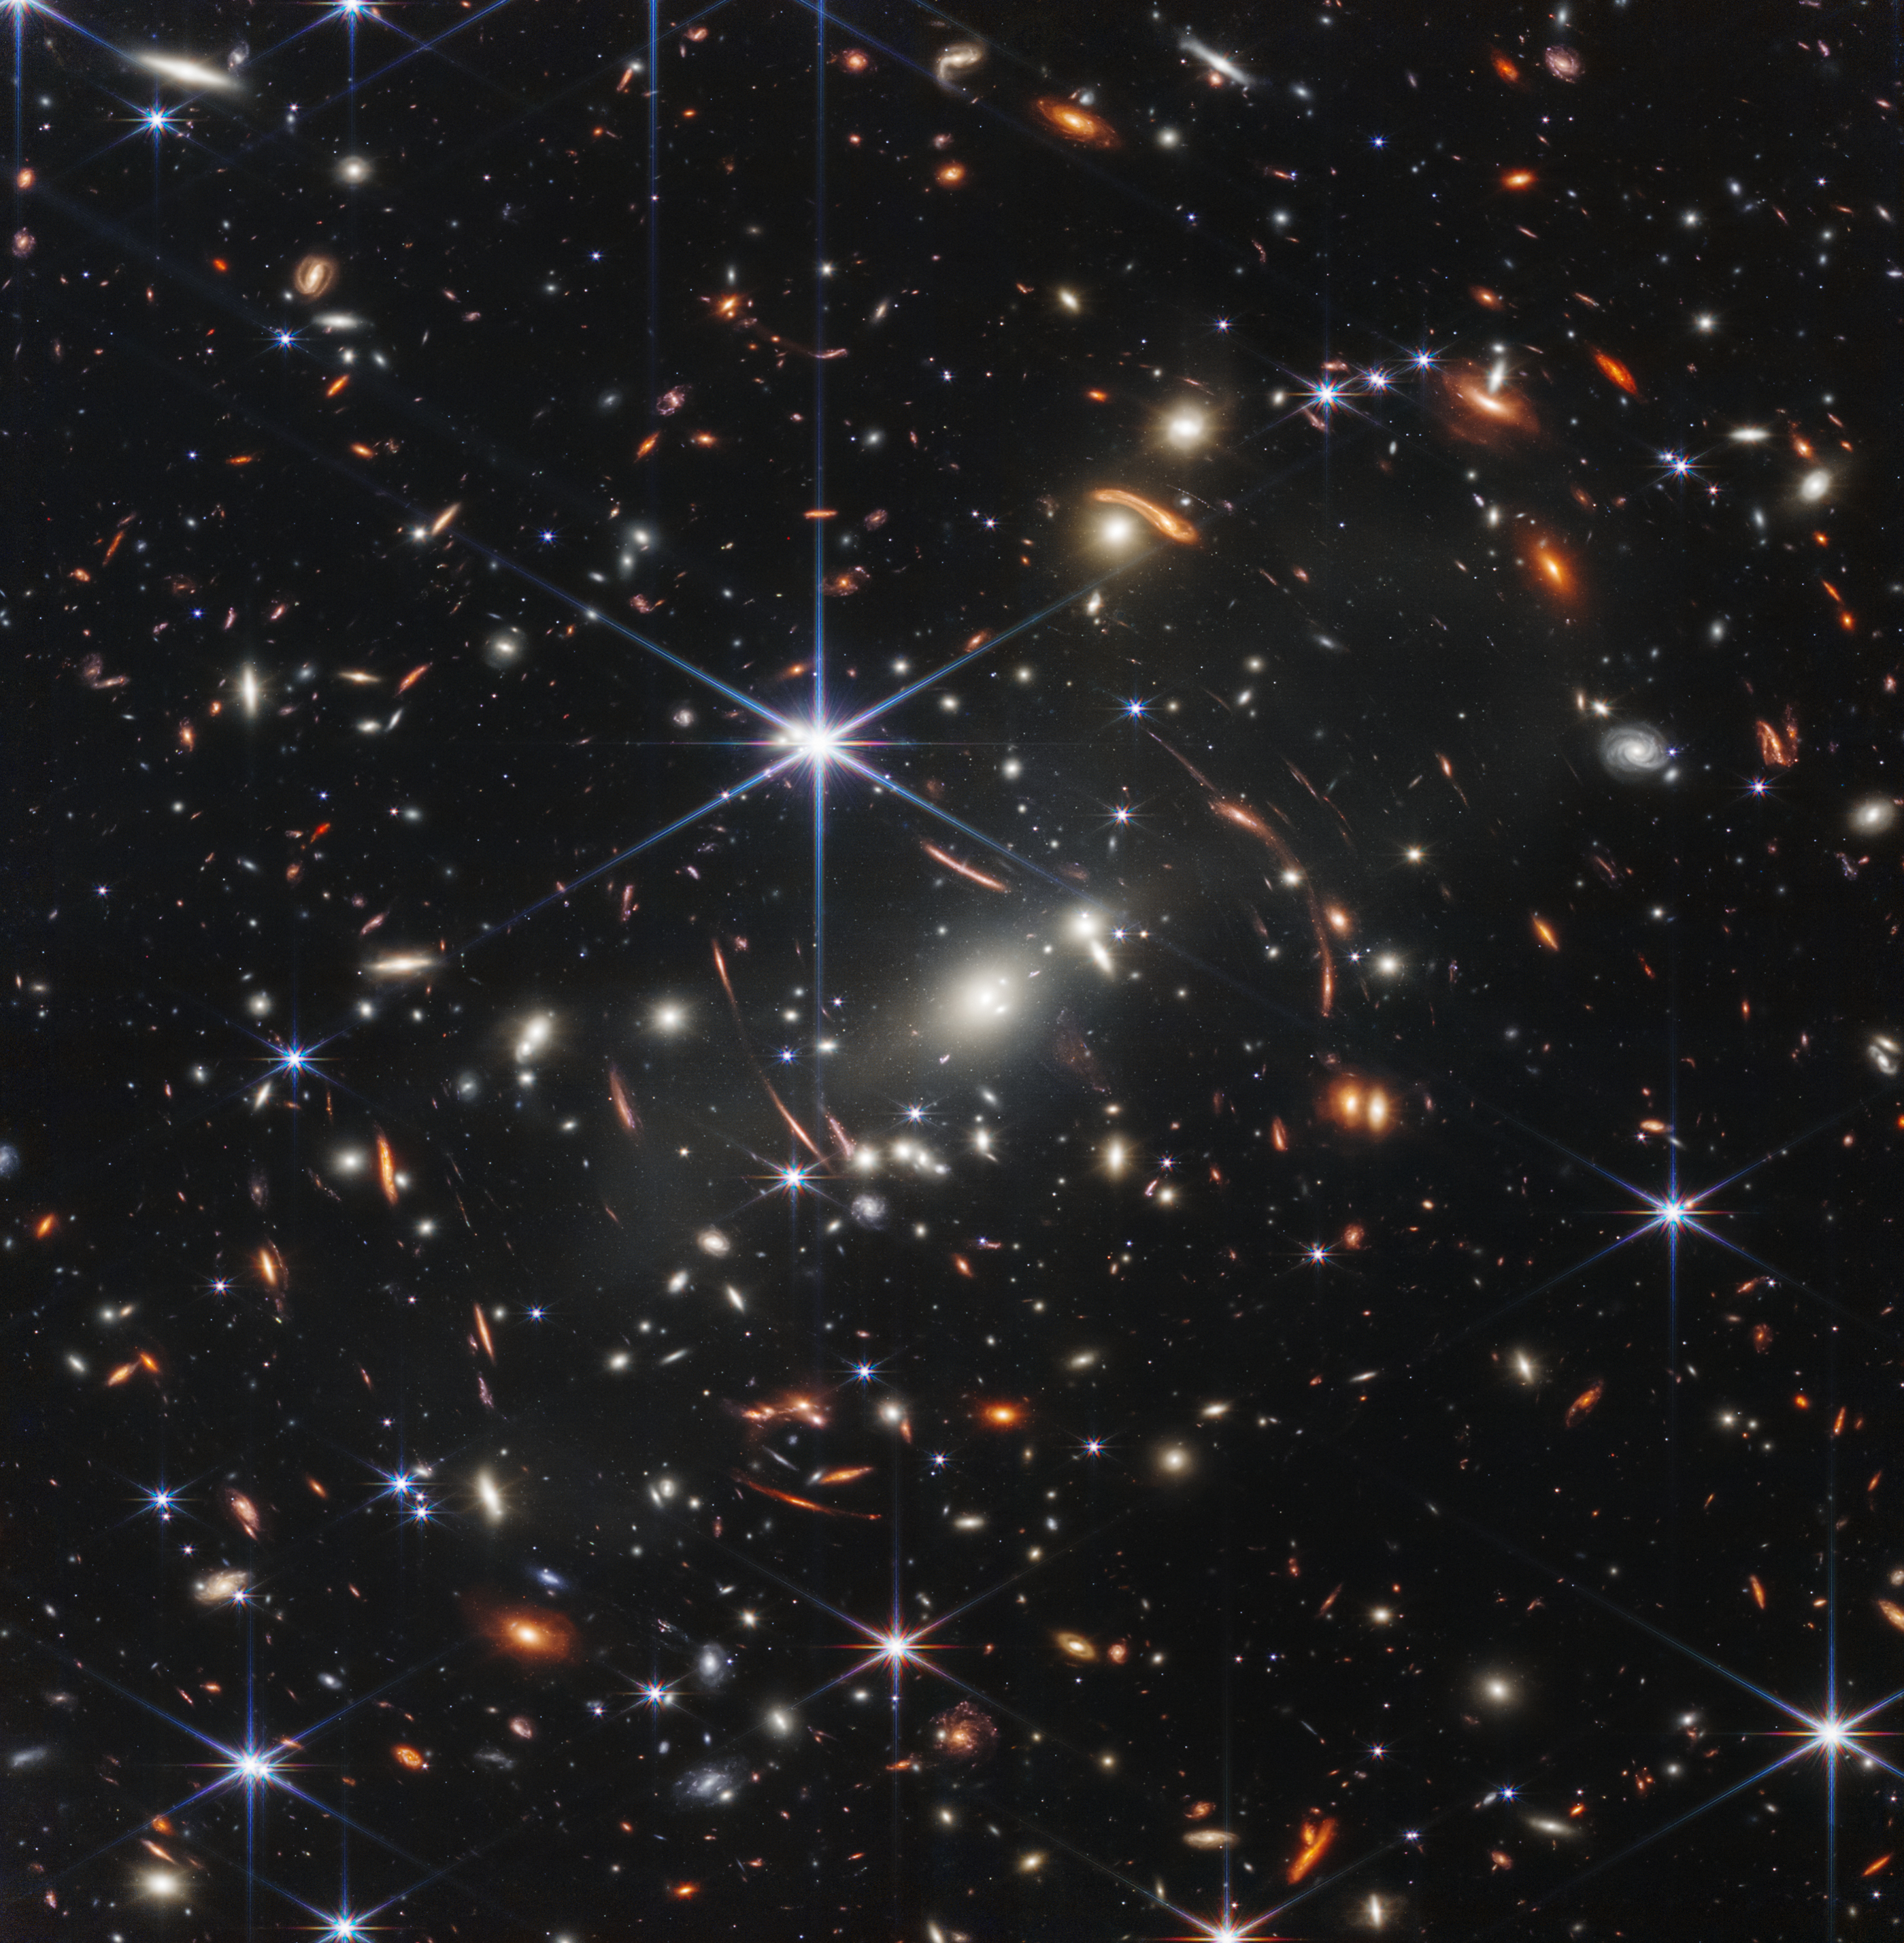
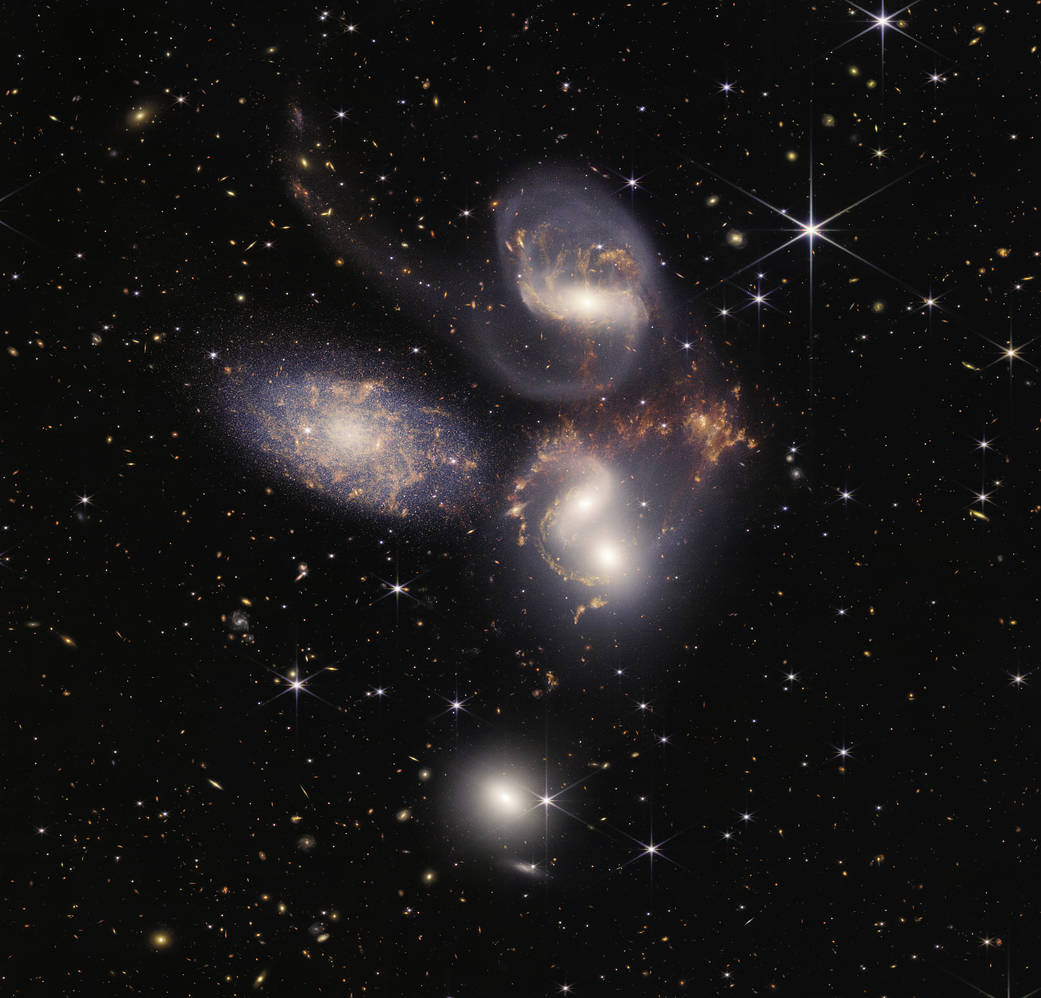
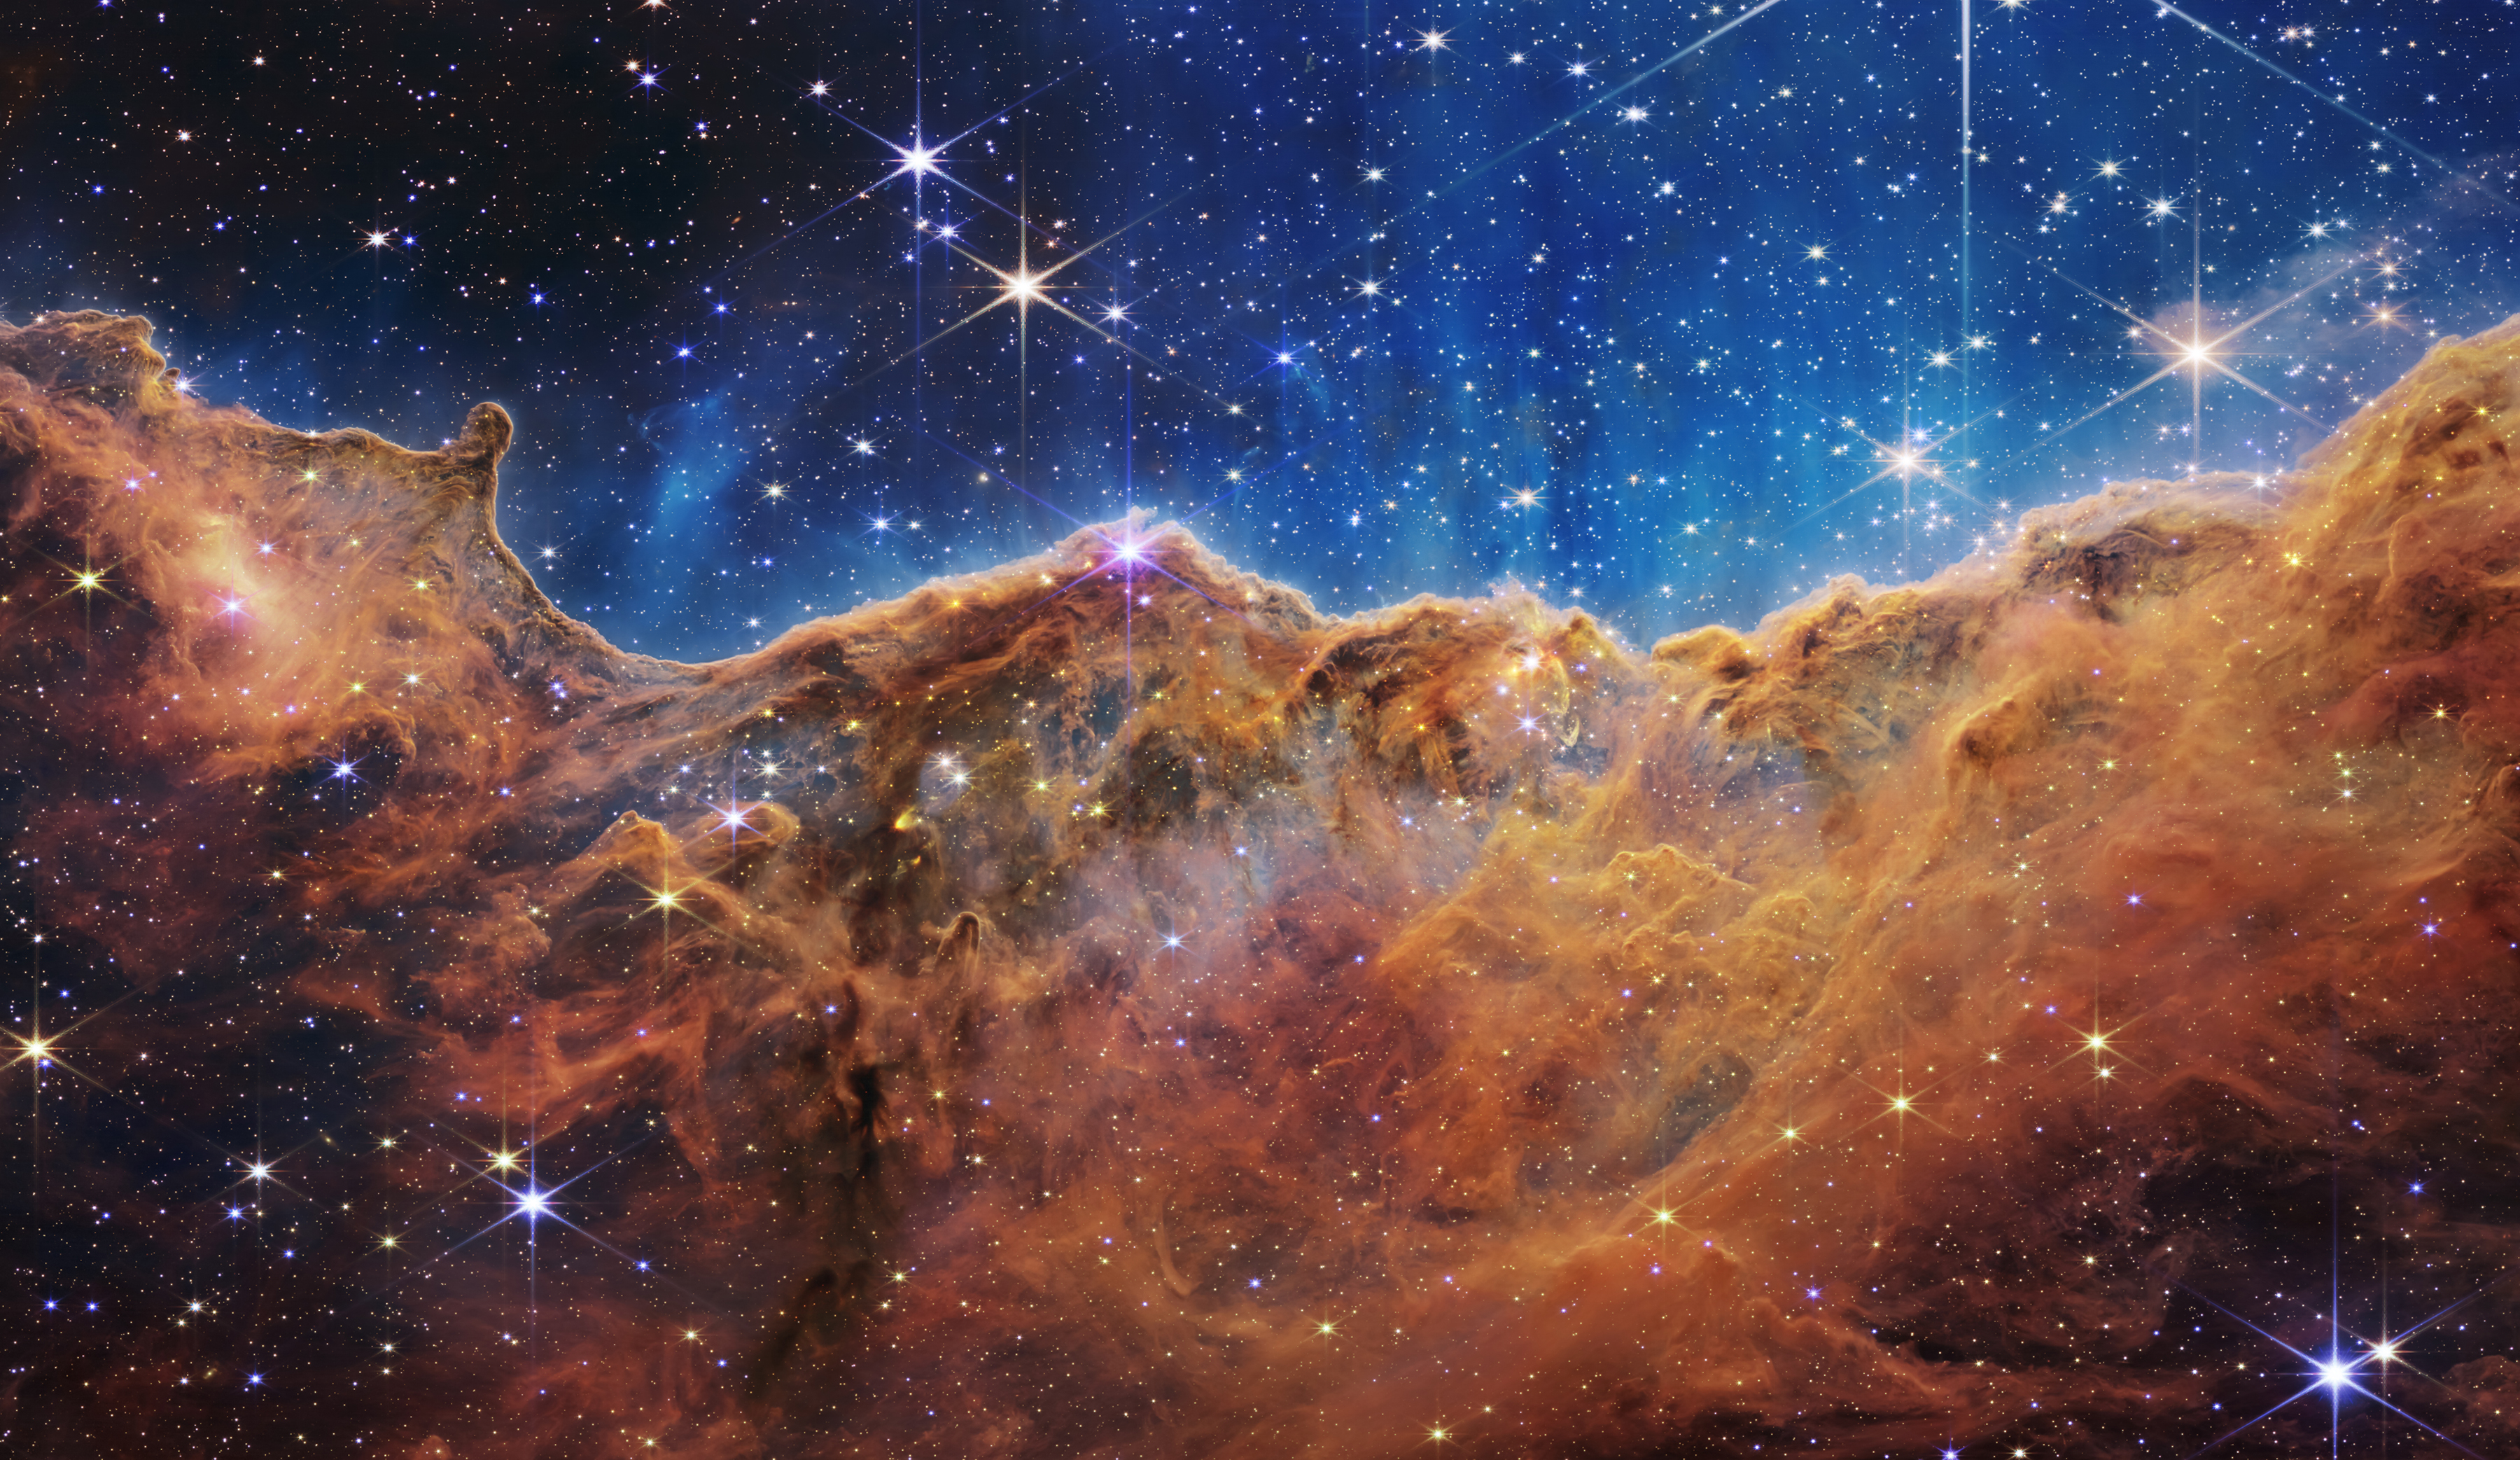
In the meantime, we’ve attached a few photos of what the JWST produced – I’m sure you’ve seen these already, and I hope you’re enjoying them as much as I am!
© NASA