
Make resilient decisions with global
wildfire intelligence.
Assess wildfire risk with a process-based global model that delivers asset-level loss metrics for informed investment and risk decisions.







The risk is rising, it's local and increasingly financial.
Wildfire is no longer a seasonal, regional problem. It now shapes credit decisions, underwriting, insurance availability, asset values, and climate-risk disclosure worldwide.
In global wildfire economic losses between 2014 and 2023, far exceeding the previous decade.
Source: UN Global Assessment Report on Disaster Risk Reduction (GAR 2025)
Risk is no longer about how much land burns; it's about which assets sit in the path.
Coarse scores can't answer that.
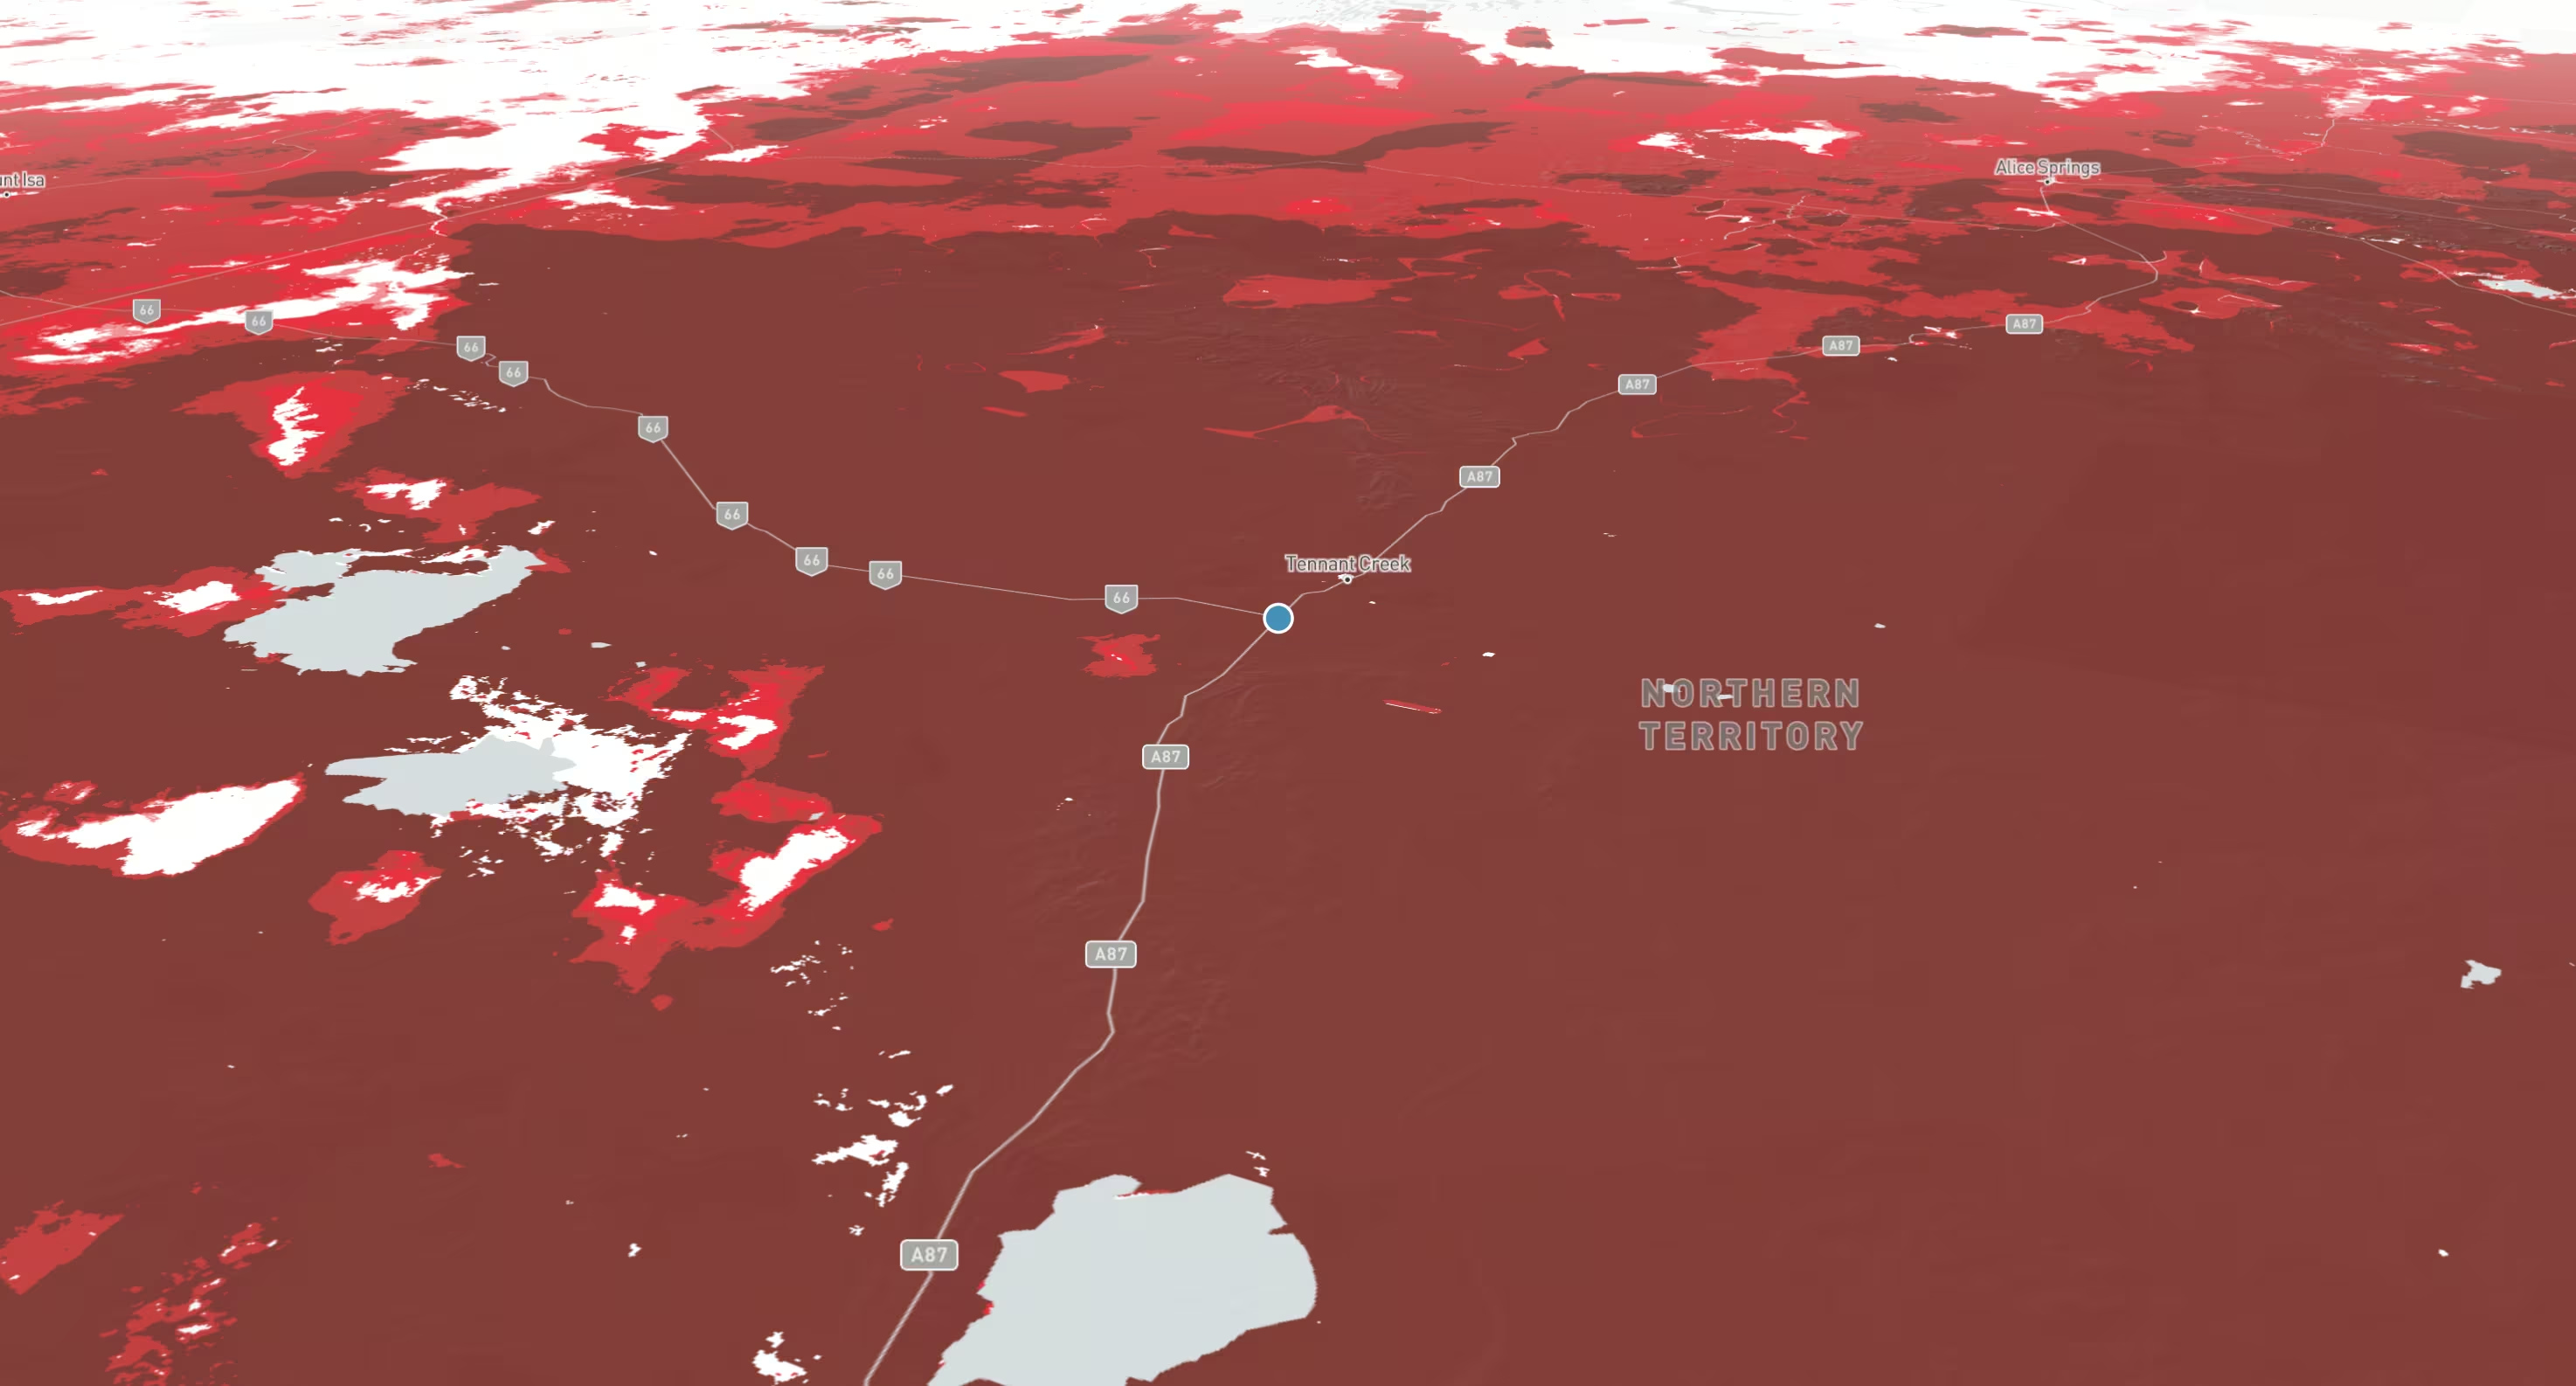
Asset-level wildfire risk, resolved to 30m / 98ft globally.
Many wildfire tools stop at broad hazard indicators. Global Wildfire goes further, simulating how fires ignite and spread across real landscapes to quantify asset-level exposure, absolute burn probability, and estimated financial loss across your portfolio.
01 · Coverage
Global coverage. One methodology
Eight regions that together cover 93% of global GDP, consistently modelled: North America, Europe, Southeast Asia, East Asia, Australia, Africa, Latin America and the Middle East. Compare California, Tuscany, Queensland and South Africa without switching models.
02 · Resolution
Asset-level,
30m outputs
Granular enough to separate neighboring assets and treat the Wildland-Urban Interface explicitly. Resolved to 30m / 98ft outputs.
03 · Methodology
Physics-based
simulation
A process-based ignition-and-spread engine (cellular automata) driven by a Machine Learning susceptibility map - not an index, not a score. Burn probability then meets each asset's vulnerability and replacement cost to become financial loss.
Decision-grade metrics, built for real workflows.
Where coarse tools flatten a whole region into one score, Climate X's new Global Wildfire model resolves risk asset by asset.
Probabilistic
Absolute burn probability, not a relative score.
Physics-based
Simulates ignition and spread, not just correlated risk factors.
Financially actionable
Connected to financial loss, not stopping at hazard.
Scenario-ready
Forward-looking to 2100 across SSP1-2.6, 2-4.5, 3-7.0 and 5-8.5.
Globally comparable
One methodology across all eight regions.
Transparent
An explainable model chain for risk, IC and regulatory conversations.
Better answers for teams that
price physical risk.
Banks | Credit & Regulatory
Support credit risk, climate stress testing and regulatory reporting with asset-level burn probability.
Insurers & Reinsurers | Exposure & Underwriting
Strengthen exposure management, underwriting oversight and enterprise climate risk with probabilistic outputs.
Asset Managers, PE & Infra | Screening & Diligence
Use comparable global wildfire analytics to screen portfolios, prioritise diligence, assess insurance exposure, and support investment committee decisions.


