


Wildfire Risk and the New Real Estate Calculus
A practical view of wildfire risk for portfolio leaders: indirect exposure, insurance signals and resilience spend that earns its return.
A co-authored report by Climate X and CBRE
Executive Summary
Wildfire risk has moved from an occasional line item to an increasingly important part of real estate decision-making. Fire seasons are lengthening and the impacts are growing, through power shutoffs, water system damage, insurance withdrawal and smoke exposure in areas that don’t experience fire directly.
This piece brings together how investment committees, insurers, occupiers and lenders are responding to that shift, and asset-level physical risk data covering direct and indirect exposure across the US.
Wildfire risk is becoming an increasingly important real estate decision
Commercial real estate assets located where the built environment meets open land are experiencing wildfire exposure earlier and more often, placing an increased importance on the interconnected decisions of real estate leaders. From site selection and acquisition underwriting, to insurance renewals and CapEx planning, longer, more intense wildfire seasons across much of the western US1 leave less room to treat the risk as an occasional line item.
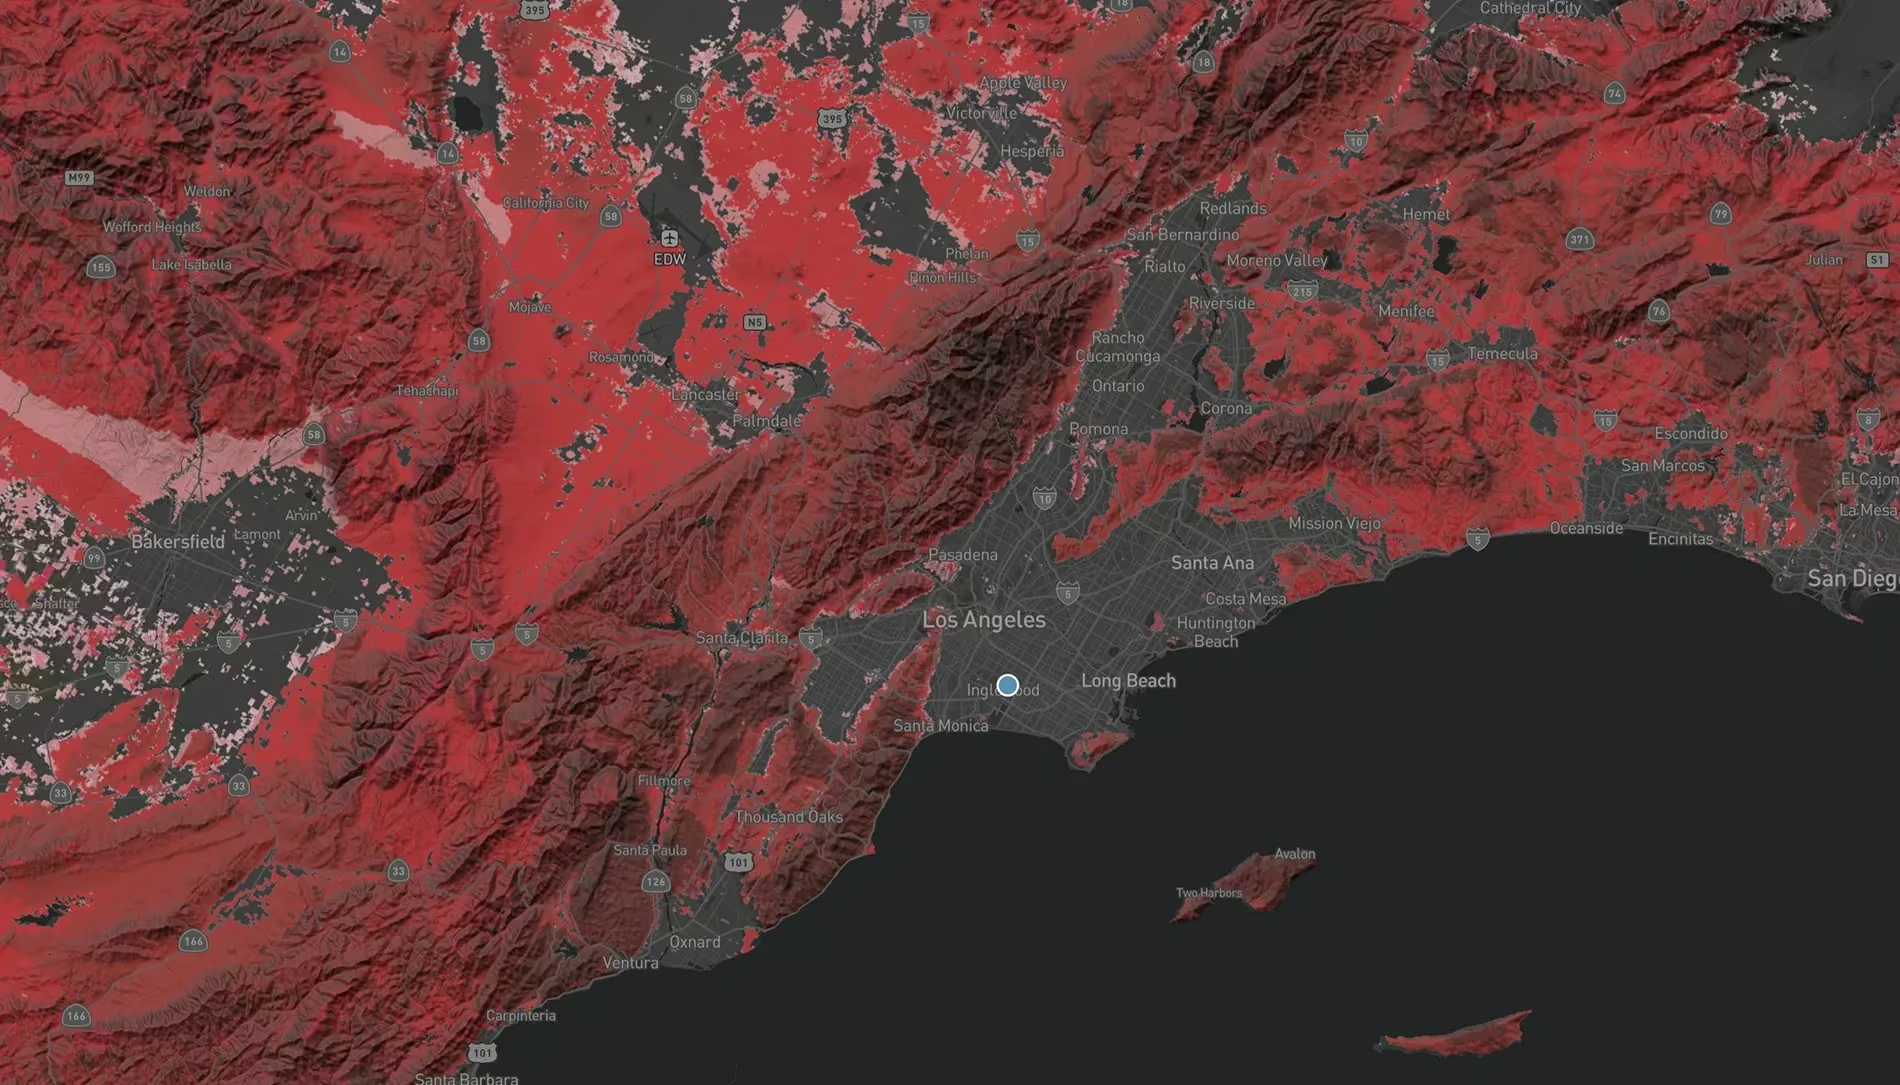
The shift is where the conversation happens. A wildfire assessment once conducted and reviewed annually rarely connected to a live deal or detailed portfolio analysis. Today, wildfire risk questions surface inside investment committees, during lease negotiations and at portfolio reviews. Property owners who articulate how they are protecting against wildfire risk are more likely to remain competitive.
For leaders looking to future-proof their portfolios amid growing wildfire risk, there are five key actions for any market or property:
- 1
Account for indirect exposure. Direct flame contact is the least common impact to an asset; smoke, power shutoffs and broader infrastructure damage, water restrictions and insurance withdrawal touch far more assets.
- 2
Read the insurance market as an early signal. Carrier appetite and pricing in a submarket often move before other data catches up, so a hard renewal conversation is more than a cost to absorb, it’s useful information.
- 3
Plan resilience CapEx at the portfolio level. Vegetation management, defensible space and hardened building envelopes cost less and do more when budgeted at scale, ahead of a loss, than when added property-by-property after an event.
- 4
Align adaptation and resilience with the plans you already have. Mapping wildfire protection measures onto existing CapEx and OpEx cycles, refurbishment programs, lease events and asset business plans optimizes commitments already being made, rather than creating a separate resilience line that competes for new capital. It provides a forward-looking view for decisions to avoid locking in long-term risk and gives investment committees answers on what was spent, where, and what it avoided.
- 5
Build wildfire into underwriting from day one. Treat it as a variable that shapes price, insurance assumptions and CapEx plans, alongside the usual site and market fundamentals.
- 6
Get ahead of what lenders and investors will ask. Institutional investors, lenders and insurers are increasingly building forward-looking physical risk analytics into underwriting, according to NAIOP’s 2026 review of the sector. A portfolio with a clear, documented view of its exposure is easier to finance and optimize asset value.
The Risk That Doesn’t Stop at the Burn Line
Overall Risk in The United States
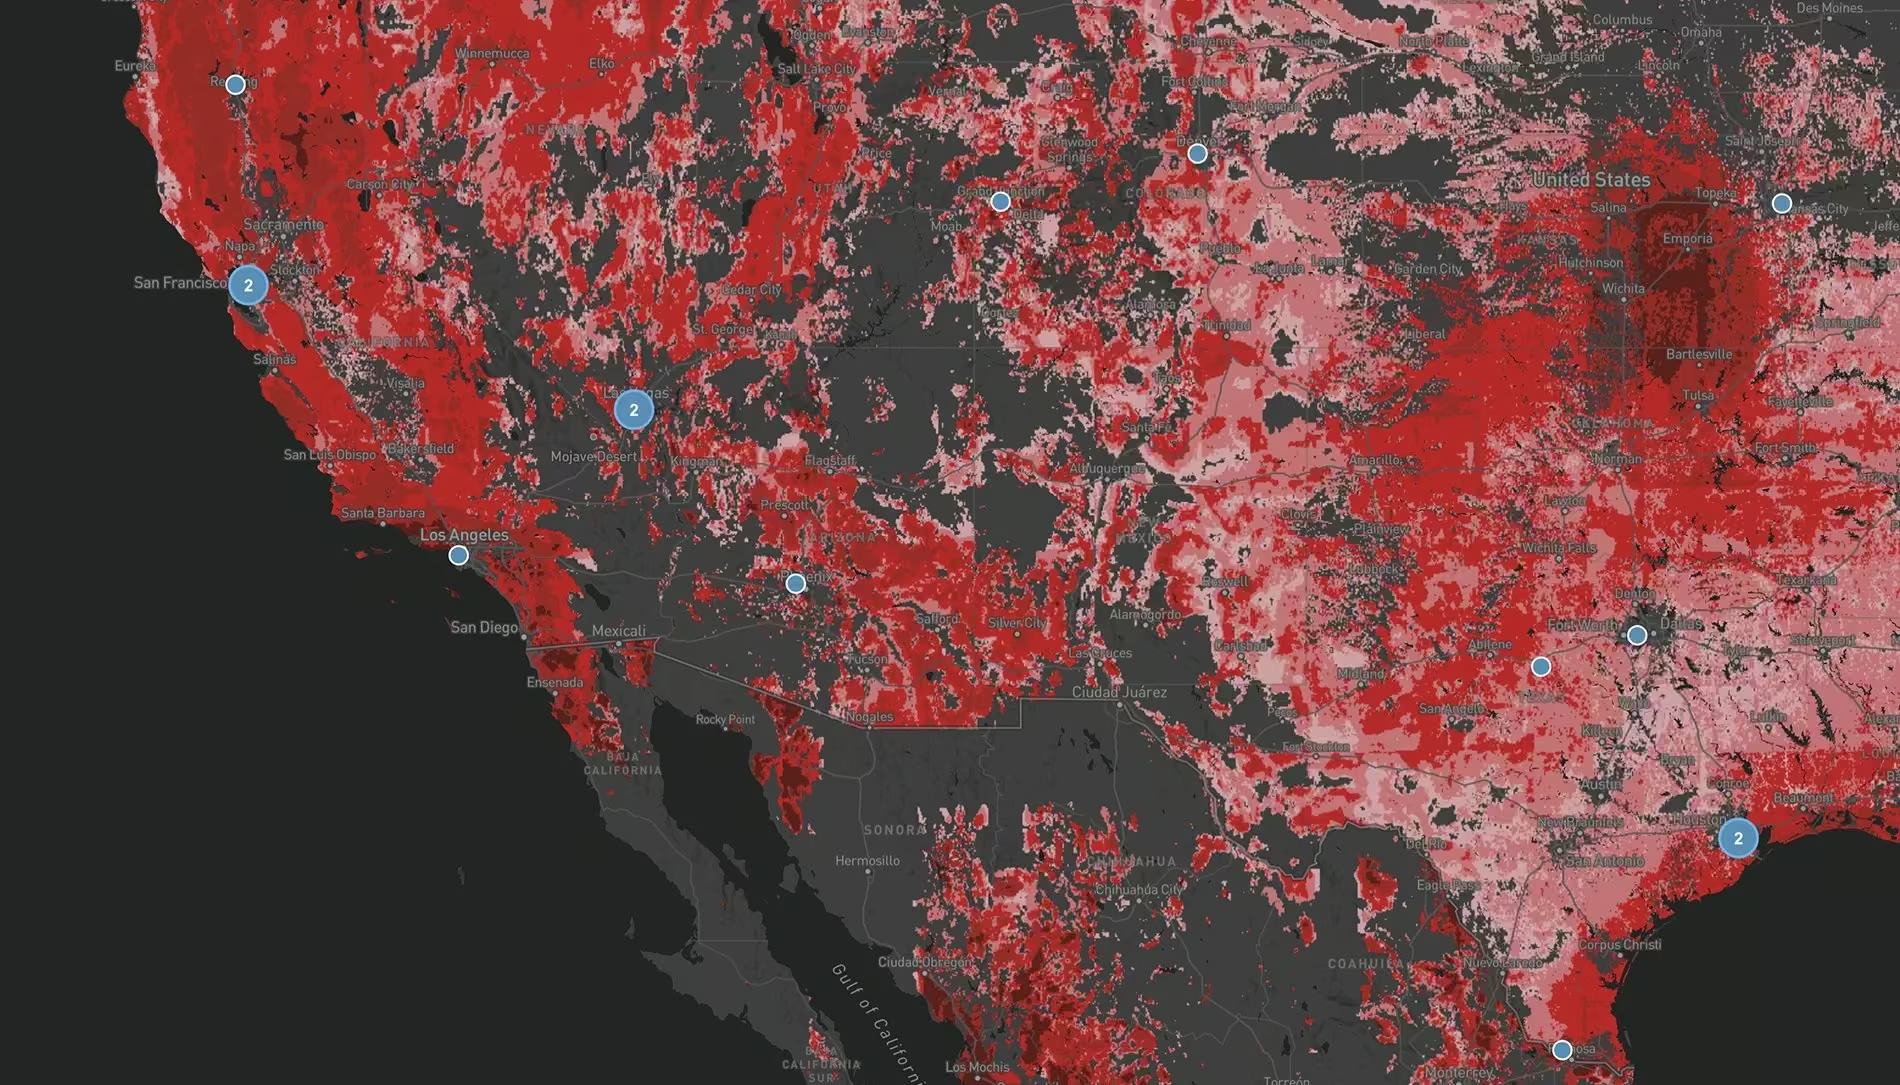
We analyzed the wildfire risk to over 170 million properties across the United States. At present, over 3.4 million premises overall are at high risk of wildfire in the US2. That’s roughly 1 in every 55 premises. In Climate X data under SSP2-4.5, the most probable scenario for moderate rising global temperatures, by 2040 this increases to nearly 3.6 million properties. All asset classes carry some degree of exposure based on location. Assets situated at the intersection of urban areas and unmanaged vegetated land—such as logistics facilities or out-of-town retail centers—face a particularly elevated risk. In addition, leisure assets near wilderness or remote rural settings are similarly vulnerable.
Table 1. Change in exposed area (square feet) of commercial real estate at high risk of wildfires between the present day and 2040 under the SSP2-4.5 Scenario.
Risk across the US is not distributed equally (see Map 1), with hotspots existing now and new ones emerging in the future. Nationally, most properties are residential; however, the number of commercial properties at high risk of direct impact increases at a similar rate: by 1.3% in the next five years and by nearly 4% in 2040 under a moderate warming scenario (SSP2-4.5). For commercial real estate, the highest-risk locations are in Florida and California. Exposure is changing fastest in the greater Los Angeles market (+15% increase in square footage exposed by 2040). In Florida, the Tampa area sees a rise of well over 8%, and in the greater Miami area more than 11% more square footage is at direct risk of burning. Importantly, these increases do not include indirect impacts but indicate the need for new thinking to bolster business resilience in the face of intensifying risk from wildfire.
Drivers of change: Evolving drought exacerbates wildfire risk in many areas
According to the National Interagency Fire Center3, by the end of May 2026 over 60% of the US was in drought and 2.4 million acres had burned, roughly double the 10-year average. One measure of atmospheric dryness, Vapor Pressure Deficit (VPD), has been closely linked to wildfire risk in multiple studies4. VPD measures the difference between how much moisture the air can hold and how much it actually holds. As this gap widens, vegetation and soils dry out faster, leading to elevated fire risk. Projections show VPD rising across the US, most steeply in the West, Southwest, and South5. At the 2040 horizon under a moderate emissions scenario (SSP2-4.5), the largest mean increases in extreme-VPD days are predicted in South Carolina, Florida, Georgia, Alabama and Michigan (as shown in Map 2).
Indirect Risks are Growing
Wildfire risk extends well beyond the properties that burn. UCLA Anderson Forecast6 estimates that the 2025 Los Angeles wildfires cost Los Angeles County around $4.6 billion in GDP along with roughly $297m in lost wages for local businesses and employees.
Electric utilities in at least five states now pre-emptively power down grids during high fire-risk weather to reduce ignition risk7. A single 24-hour interruption costs a typical large industrial site $190,000 on average. The tail can be more severe: one semiconductor’s U.S. fabrication (fab) plant disclosed $270-360 million in damages from one Texas blackout8. The resulting power loss can also depressurize water systems and draw contaminants into pipes, while fire heat can damage water infrastructure directly and leach chemicals into the supply9.
Wildfires also have impacts beyond the burn perimeter. Studies in California and Nevada have found measurable price discounts for homes near recent fires and in areas of heavy smoke exposure10. Smoke exposure is a nationwide problem: per-person wildfire smoke particulate matter (PM2.5) exposure was four times higher in 2020–2024 than in 2006–201911. Persistent smoke degrades the desirability of places that don’t burn and is starting to influence where people choose to live and what they will pay to live there.
The cost of inaction
Wildfire season used to have predictable start and end dates, but is no longer easy to forecast. Extreme weather is stretching fire seasons longer across much of the US, and the losses from a longer season are landing in markets that have not priced in the risk yet.
The Capital Questions Are Starting Now
We’re increasingly seeing end investors ask their asset managers and boards what they are doing about wildfire risk. The question and its specificity are new, driven by recently observed events, and there are consequences for not answering credibly.
Investors want to know operating cost exposure (including insurance implications), the view of tenants, and what happens to asset value and liquidity if a major event occurs. Whether the answers to those questions move markets to reprice assets remains unclear. But the questions themselves signal that capital is starting to focus on climate risk, and wildfire in particular, as a material financial impact for some organizations and not just a disclosure requirement.
Regulation and Lender Pressure Forcing the Pace
Sustainability reporting requirements—such as California’s climate disclosure regulations, the EU’s Corporate Sustainability Reporting Directive (CSRD) and the International Sustainability Standards Board (ISSB) disclosures adopted by some countries and impacting those deploying capital internationally, including the U.S.—are pushing organizations to quantify climate risks, including wildfire exposure, and communicate governance and mitigation strategies. But regulation isn’t the only driver. Lenders are already tightening requirements: screening portfolios, requiring resilience assessments, and building climate risk into credit decisions. Central banks are watching whether capital markets can absorb climate impacts. That focus is trickling down to financing terms and availability, with implications for entities unaffected by regulations.
Disclosure requirements increase scrutiny, lenders respond faster than markets, and the cost of capital shifts before asset prices do. We expect to see this pattern accelerate.
The Timing Question: Act Now or Pay Later
The economics are asymmetric. Designing resilience into new development is comparatively inexpensive and straightforward. Retrofitting existing stock to protect against wildfires can be expensive and, in some cases, uneconomic. The implication is clear: decisions made today about where to develop, what to hold, and what to upgrade will either minimize or entrench wildfire exposure.
Asset managers and boards that act early can design resilience into capital deployment. Those that wait will manage higher risks and potentially lose asset value. We expect to see the former approach drive competitive advantage as lenders and investors distinguish between partners who understand and plan for their current and future risk exposure and those who do not.
Resilience Is a Capital Allocation Decision, Not a Line Item
Treated as a compliance cost, wildfire resilience is a drag on returns. Treated as a capital allocation, it becomes a way to protect income, hold insurance terms and defend valuation at exit. The difference is whether a portfolio can put numbers against it: which assets carry the exposure, what the measures cost, what loss they avoid, and what return that implies.
That is where asset-level physical risk data earns its place in the process. Quantifying wildfire exposure across a portfolio, costing vegetation management, incorporating defensible space and envelope hardening against the losses they avert, and ranking those measures by return turns adaptation into a prioritized plan rather than a wish list. It also gives sustainability, risk and investment teams one set of numbers to work from.
Occupiers Are Starting to Count the Cost
Occupiers care first and foremost about the safety and wellbeing of their workforce and customers. But operating cost stability and business continuity are also paramount considerations. We’re seeing tenants in high-exposure regions begin to factor wildfire risk into location decisions. It’s not yet driving vacancies or lease rejections at scale. But it’s entering the conversation.
For some sectors, including logistics, data centers, food processing and retail, a major fire event creates not just direct damage but supply chain disruption and revenue loss. Tenants managing portfolios across multiple geographies are starting to consider to what extent their portfolios are exposed to climate hazards that may have direct business impacts. We expect the gap between prepared occupiers and those treating this as a tail risk to widen.
Markets Will React Unevenly
Wildfire events are localized and sudden. Recovery is slow. This creates a distinct dynamic: behavior tends to shift incrementally in calm periods and sharply after a major event. Markets unprepared for disruption face sudden cost spikes, lender tightening, occupier caution, and insurance challenges.
The real exposure isn’t uniform. It’s concentrated in specific geographies and asset classes. Asset managers and occupiers who understand asset risk profiles can act with confidence.
Wildfire Risk and the New Real Estate Calculus
CBRE is the world’s largest commercial real estate services and investment firm and a premier provider of critical infrastructure services. Climate X is the leading risk intelligence platform empowering financial institutions and real estate owners.
A co-authored report by Climate X and CBRE
Authors

References
- Climate Central. (2016). Western wildfires: A fiery future. https://assets.climatecentral.org/pdfs/westernwildfires2016vfinal.pdf
- Greater than 1% burn probability annually according to Climate X modelling
- Western Fire Chiefs Association. (2026, June). El Niño confirmed, fire chiefs now have a clearer view of the 2026 wildfire season. https://wfca.com/insights/2026-fire-season/
- Abatzoglou, John T., and A. Park Williams. 2016. “Impact of Anthropogenic Climate Change on Wildfire across Western US Forests.” Proceedings of the National Academy of Sciences 113 (42): 11770–75. https://doi.org/10.1073/pnas.1607171113.
- Williams, E., Funk, C., Peterson, P., & Tuholske, C. (2024). High resolution climate change observations and projections for the evaluation of heat-related extremes. Scientific Data, 11(1), 261. https://doi.org/10.1038/s41597-024-03074-w
- Li, Z. and Yu, W. (2025) Economic Impact of the Los Angeles Wildfires. Los Angeles: UCLA Anderson Forecast. Available at: https://www.anderson.ucla.edu/about/centers/ucla-anderson-forecast/economic-impact-los-angeles-wildfires (Accessed: 21 September 2026).
- PSE Healthy Energy. (n.d.). Public safety power shutoffs explained. Retrieved September 21, 2026, from https://www.psehealthyenergy.org/public-safety-power-shutoffs-explained/
- CBRE. (2026). Distributed generation guidebook: Choosing the right on-site power asset for reliability, economics, and speed to power. CBRE Insights. https://www.cbre.com/insights/reports/distributed-generation-guidebook
- Whelton, A. J., Seidel, C., Wham, B. P., Fischer, E. C., Isaacson, K., Jankowski, C., MacArthur, N., McKenna, E., & Ley, C. (2023). The Marshall Fire: Scientific and policy needs for water system disaster response. AWWA Water Science, e1318. https://doi.org/10.1002/aws2.1318
- Lopez, L. A., & Tzur-Ilan, N. (2023). Air pollution and rent prices: Evidence from wildfire smoke plumes in Las Vegas (SSRN Working Paper No. 4537395). https://dx.doi.org/10.2139/ssrn.4537395
- Climate Central, “Climate Change Worsens Wildfire Smoke,” Climate Matters, August 20, 2025. Available at: https://www.climatecentral.org/climate-change-worsens-wildfire-smoke-2025

