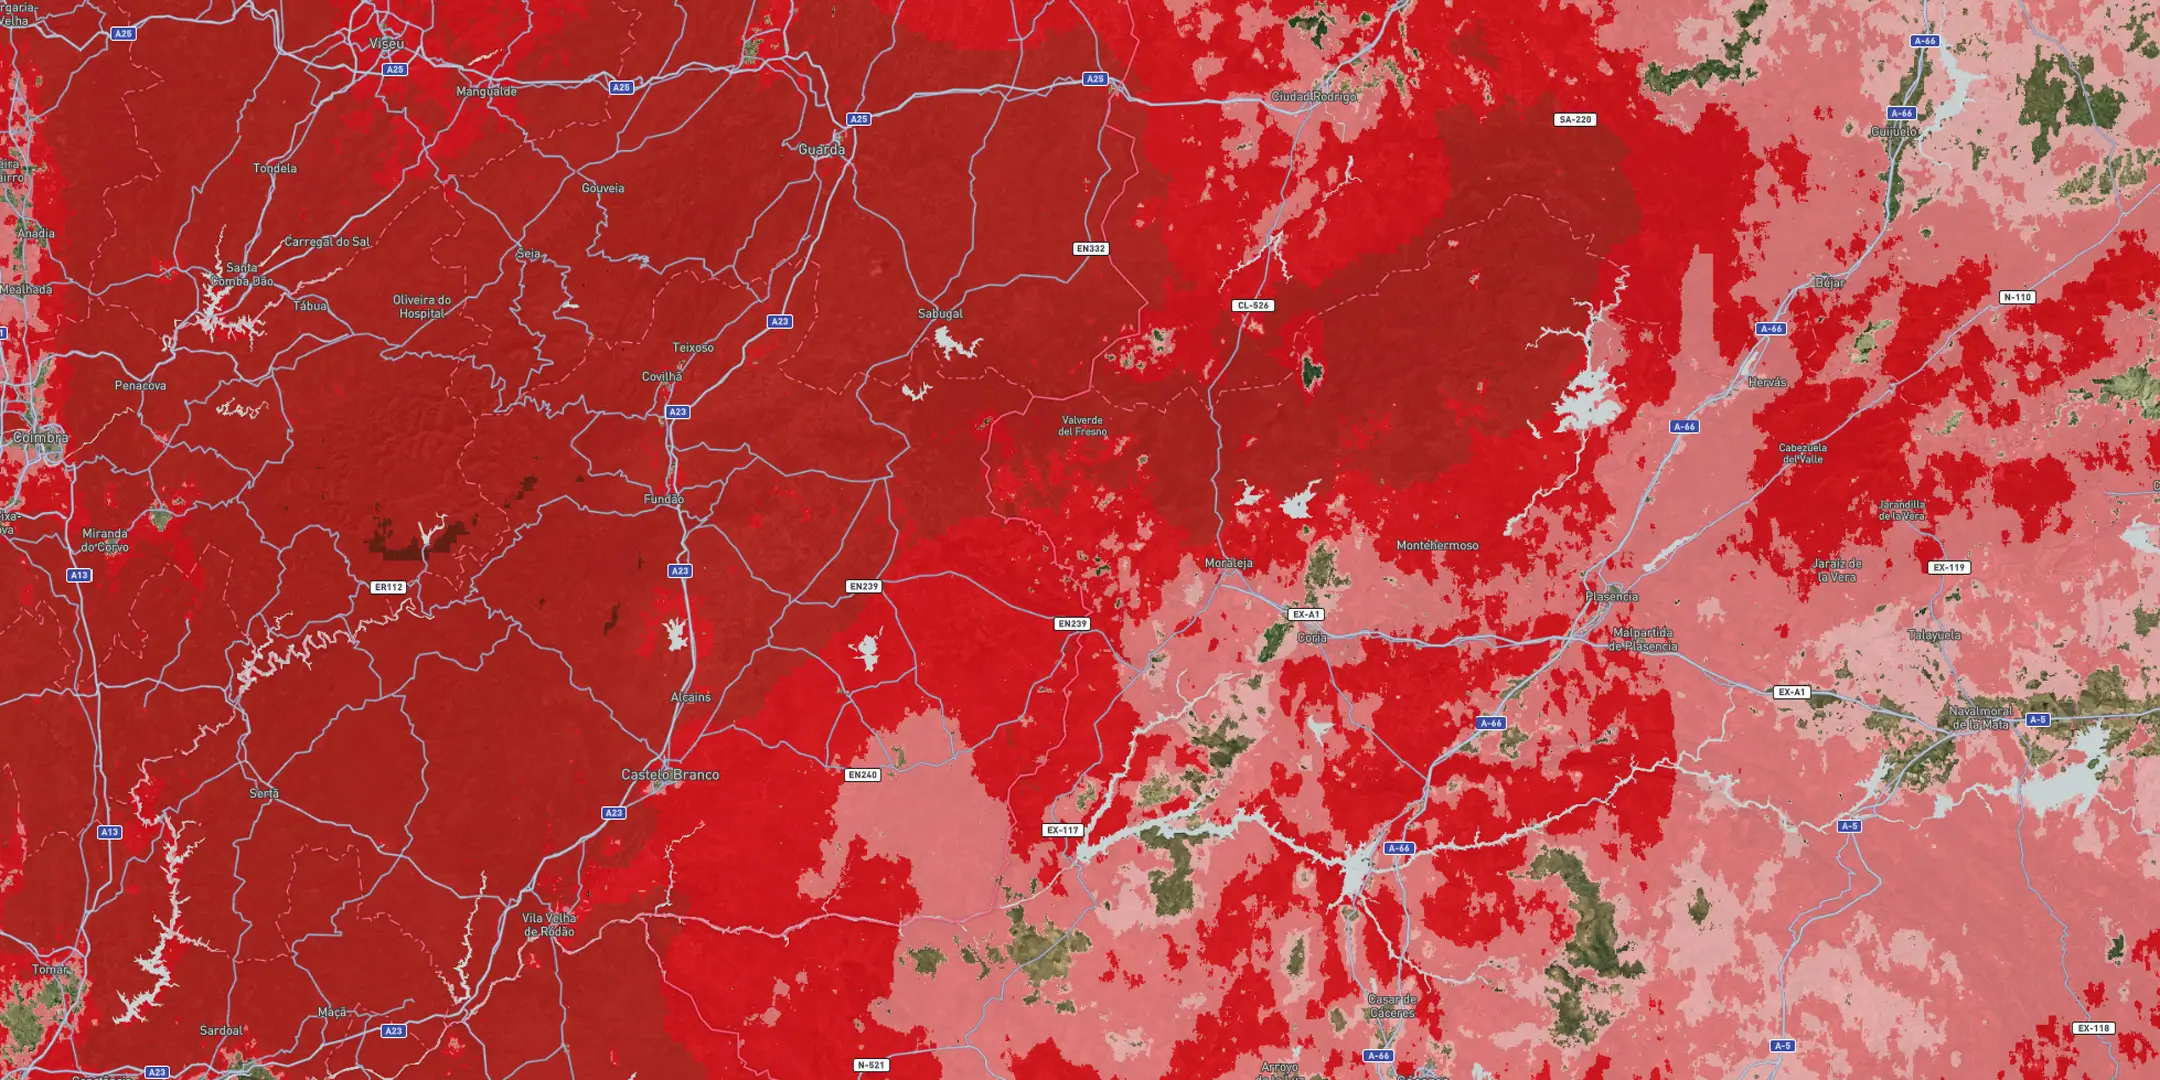
Insights from Climate X's scientists on wildfire modeling and how to evaluate wildfire risk data.

TL;DR
- Wildfire is one of the most complex climate hazards to model, shaped by everything from weather and terrain to vegetation and human activity.
- Historical fire maps tell us where fires have happened, but not where they’re most likely to happen in the future.
- Modern wildfire models use climate projections and stochastic simulations to estimate annual burn probability.
- The result? Asset-level financial loss estimates that support better risk management and investment decisions.
Audio Deep Dive
Duration: 19 mins

Climate X
Climate X

Climate X
In our latest wildfire webinar, Solutions Engineering Lead Austin Clack sat down with Climate X scientists, Dr Tricia Sullivan and Dr Georgios Sarailidis, to unpack why wildfire risk is so difficult to model and what financial institutions should consider when assessing risk across underwriting, insurance renewal, credit risk and investment decisions.
Watch the full webinar to hear the scientists explain why wildfire is so hard to model, how the Climate X model works and how banking, asset management, insurance and real estate teams are putting the outputs to work.
Watch full conversation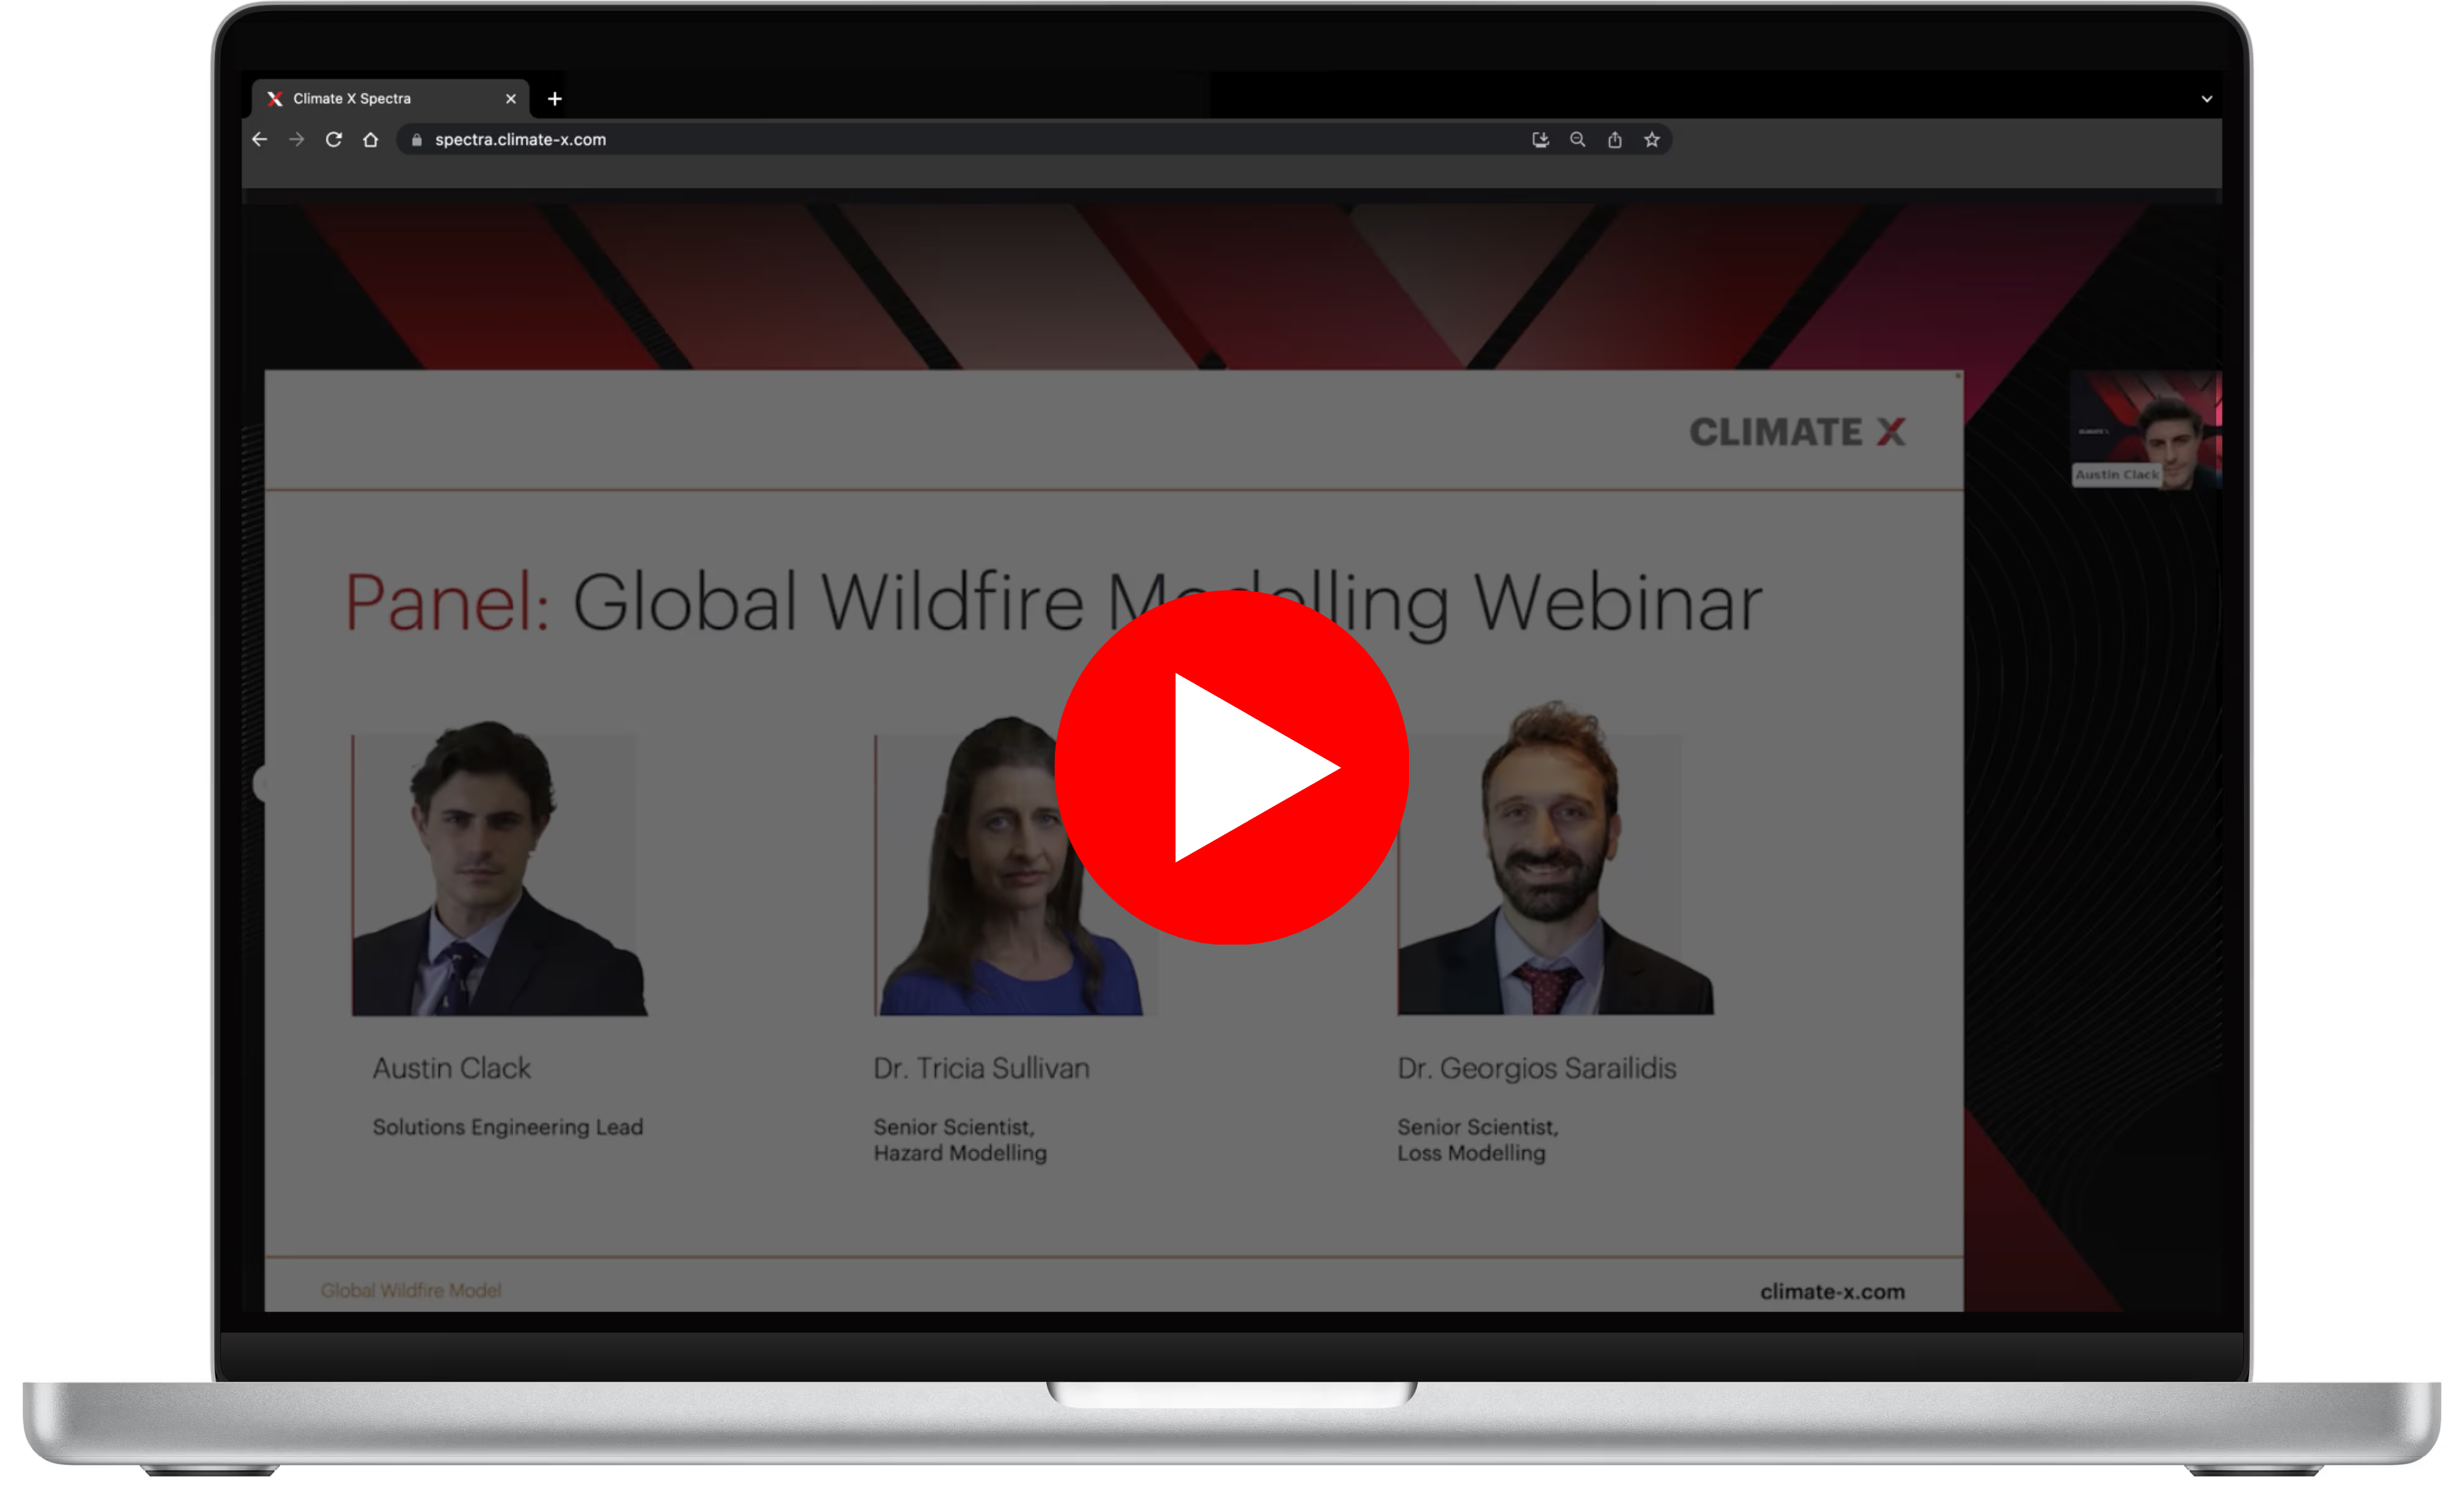
Fire is a complex physical phenomenon, and it’s very difficult to model, even on very small scales, let alone trying to tackle it globally.
Dr. Tricia Sullivan, Climate X
Increasing Global Wildfire Risk
Wildfire is becoming materially more expensive, costing billions in global losses each year, and recent losses have not been confined to the places and seasons that historical records would predict.
The January 2025 fires in Los Angeles destroyed more than 16,000 structures. UCLA Anderson estimated total economic losses to be $76 billion to $131 billion, with insured losses up to $45 billion. They burned in January, outside the region's usual fire season, during Santa Ana winds.
2026 is already tracking well above the historical average for number of recorded fires in Europe, with around 1,200 fires already recorded by late July, compared to the long term average of 569 (of the last 20 years). What’s noticeable is that many fires are happening increasingly outside the Mediterranean regions where fire is traditionally concentrated.
These losses reach financial institutions through insurance availability, collateral value and portfolio exposure. As insurers reprice or withdraw cover, lenders may face higher LTV and provisioning risk, while investors may need to revisit acquisition pricing, capex and exit assumptions. For these teams, asset-level wildfire risk is essential for defensible decision-making, but difficult to estimate.
The key challenge is that wildfire risk is local, dynamic and non-stationary. Past fire footprints help explain where fire has occurred, but financial institutions need to know where fire could occur, how likely it is, and what it could cost.
The Drivers of Fire Behavior
A wildfire results from several conditions occurring in sequence, beginning with ignition.
Ignition is defined as: The point at which fuel reaches ignition temperature, reacts with oxygen, and begins a self-sustaining combustion process.
In the US, close to 85% of wildfires are started by people, so ignition depends in part on land use, infrastructure and population rather than on weather alone. Lightning is another major source, and is inherently difficult to predict at the specific location and time that matter for a fire event. Dr Sullivan explained the challenge this way:
If we don’t know where it’s going to start, that makes it very difficult. And then, once it starts, where is it going to spread? This is highly contingent on the vegetation in the area, the terrain, the slope, the elevation, the climate conditions, how dry the vegetation is, and the behavior of the wind."
Dr Tricia Sullivan, Climate X
Whether an ignition results in a self-sustaining fire depends on a number of factors:
Fuel moisture is one of the main routes through which climate acts on fire. Vapor pressure deficit (VPD), a measure of the atmosphere’s demand for water, is derived from temperature and humidity and is strongly linked to dead fuel moisture across forest and woodland biomes. As the VPD rises, fuels can dry more quickly, increasing ignitability and, under the right conditions, rate of spread. Wind speed and direction, slope, terrain and suppression capacity then determine how far and how fast a fire travels and what it reaches.
Factors That Determine Fire Damage
Because these drivers vary over short distances, two assets close together can carry very different risk depending on vegetation, aspect, exposure to prevailing wind, and the construction and clearance around each structure. The overall level of asset damage will be determined by:
Fire spread is therefore a multi-physics, multi-scale problem. The rate of spread is governed by combustion, heat transfer and airflow interacting across scales that range from an individual fuel bed to regional weather.
Predicting Future Wildfire Risk
Wildfire modeling incorporates historical data, but the historical record is limited. At scale, the main observational evidence comes from satellite-detected burn scars, which are valuable but only go back a few decades. That is short relative to forest regeneration cycles and the return periods that matter for infrastructure, mortgage books and long-term risk management.
We always want to be data-driven, so we want to look at the historical data. But the problem with the historical wildfire data is that, on any kind of scale, you’re dealing with satellite imaging of burn scars that tell us where fires have happened. That only goes back a few decades."
Dr Tricia Sullivan, Climate X
The absence of a historical burn scar at a location is not evidence of safety and fire does not need to recur in the exact same place to reveal the same underlying conditions. The more useful question is whether another location has the same combination of vegetation, terrain, climate and ignition conditions that have enabled fires elsewhere.
For financial risk assessment, this historical limitation is compounded by non-stationarity. Historical fire climatology is useful for estimating baseline risk, but it is not sufficient for long-duration assets, mortgage books or climate scenario analysis, where the relevant question is how burn probability changes over time.
Forward-looking models therefore need to condition fire probability on climate projections, not extrapolate from historical averages alone. As Dr. Sullivan explained:
We [Climate X] use the Coupled Model Intercomparison Project, better known as CMIP6. These are large simulations of future climate. They’re the ones used by the IPCC, and they scale forward across the century under different scenarios."
Dr Tricia Sullivan, Climate X
A strong model can then relate projected changes in climate variables to changes in burned area and annual burn probability. This allows wildfire risk to vary by scenario, geography and time horizon rather than assuming that past fire conditions remain constant.
Conditioning on physically meaningful climate drivers, rather than extrapolating from a single historical risk score, helps keep the methodology applicable across regions and interpretable to a validation team.
Wildfire Modeling Approaches
Wildfire models often combine elements of three broad approaches:
01 Empirical, statistical and index-based models
Correlate observed fire outcomes with variables such as weather, fuel, vegetation and historical burn patterns. Fire-weather indices sit in this category, translating meteorological conditions into indicators of fire-conducive weather.
02 Physical and quasi-physical models
Represent the underlying physics of fire directly, including combustion, heat transfer, airflow and fire-atmosphere interaction.
03 Semi-empirical and simulation-based models
Combine simplified physical relationships with empirical calibration and simulation, estimating how fires spread across real landscapes using approaches such as Rothermel-style rate-of-spread models, minimum-travel-time algorithms or cellular automata.
Climate X's approach
Climate X takes a hybrid, process-based simulation approach. Global Wildfire simulates how fire spreads, from ignition through to asset-level burn probability and financial loss, across global portfolios and climate scenarios. Explore the model below.
Explore Global Wildfire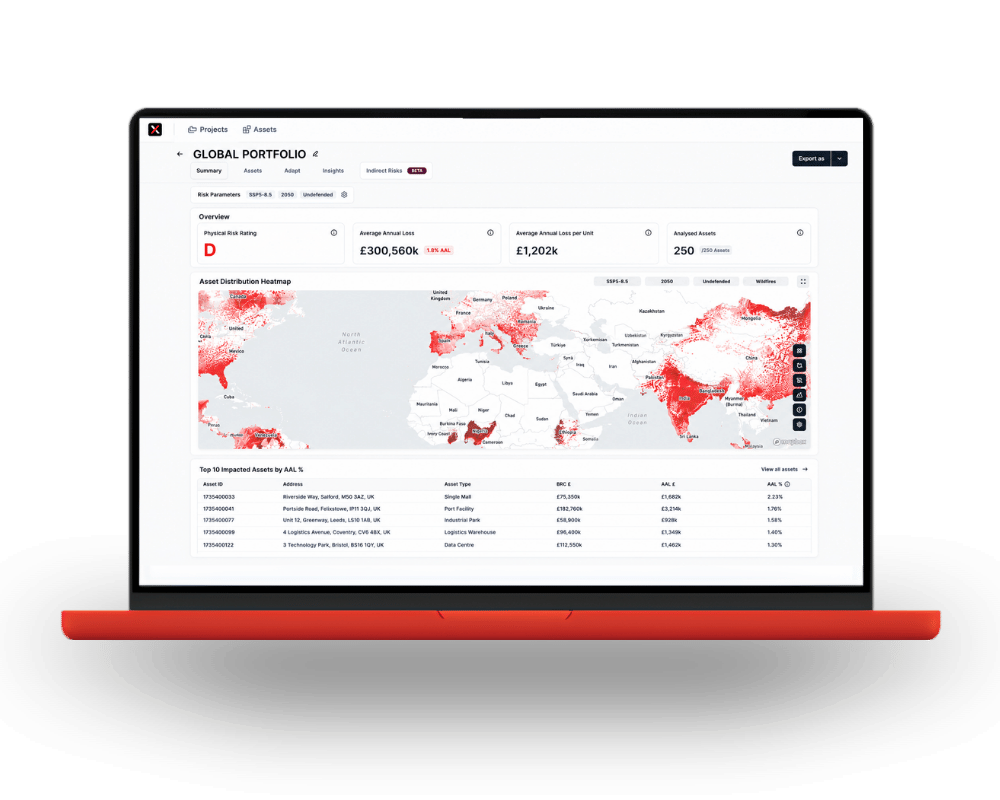
How to Model Wildfire Burn Probability
A spread model can show how one fire might behave, but risk pricing needs an annual burn probability at a specific location. That cannot be taken directly from the historical record because, while large fires drive most losses, they are rare, unevenly recorded and often cause damage far from where they ignite.
Burn probability = the estimated annual likelihood that a specific location will burn in a wildfire.
Stochastic Simulation
Stochastic simulation estimates absolute burn probability by generating many plausible fire seasons and tracking how often each location burns. Climate X takes the following approach:
01 Define the simulation domain
The landscape is represented as a grid, with each cell covering approximately 100 square kilometres. An individual model is built for each cell on the planet's surface.
02 Establish the local conditions in each model cell
A susceptibility map is generated from topography, vegetation, past burn behaviour and lightning or human ignition proximity, alongside statistical distributions for the expected number of fires annually and the expected fire size in that cell. A distribution of the cell's wind conditions associated with past fires is also built.
03 Propagate fire across the cell
A fire is ignited on the susceptibility map, gridded at 30m resolution. The spread model simulates how each ignition moves through the landscape under the wind according to the local conditions.
04 Build a library of simulated fires
Fires are ignited and spread 50,000 times for every cell. Each time, wind is sampled from the cell's wind model, and size is chosen from its size model.
05 Use the fire library to make a synthetic year
A year's worth of fires is then selected from the fire library. Fire count is determined from the ignition distribution, and sizes are chosen based on the fire size distribution. The result is a single "fire year" for that cell.
06 Repeat across many synthetic years and calculate the mean
This is repeated another 99,999 times to build up a large event set. At every 30m pixel, the number of burns across 100,000 years is counted and divided by 100,000 to get an annual probability that can be used in asset-level risk and loss calculations.
07 Apply future climate scaling
Once baseline burn probabilities are established for each cell, risk is scaled out into the future using CMIP6 climate models. These models predict changing atmospheric conditions under different future scenarios, going forward across the century.
Because large fires are rare but drive much of the burned area and loss, models need a large sample of simulated seasons to characterize tail events with stability. Outputs are calibrated against observed fire distributions, using satellite burned-area products such as MODIS and the Global Fire Atlas as an observational basis.
Burn probability is often the more natural primary expression for wildfire than a return period. Unlike river flooding, fire does not recur in a fixed location at a stable frequency, so a location-specific annual probability, convertible to a return period where a workflow requires one, represents the underlying process more directly.
How to Model Wildfire Financial Loss
Burn probability estimates how likely a location is to burn, but financial institutions need to understand the likely consequence for an individual asset, such as repair cost, insurance impact, expected annual loss or scenario loss.
A score can tell you something might look risky. It doesn't clearly tell you the probability that fire reaches a door, and what the cost of that exposure could be."
Austin Clack, Climate X
A wildfire loss model should follow standard IPCC risk framework, converting hazard into a financial figure through four linked components:
Asset-level vulnerability is critical because assets inside the same fire perimeter do not experience the same damage. As Dr Sarailidis explained:
It’s commonly assumed that every asset, building, structure or infrastructure within the fire perimeter will have the same chance of burning, or is damaged in the same way. But if we look at past fire events, we see a different story."
Dr Georgios Sarailidis, Climate X
Several factors explain that variability: fire behavior (flame length, ember spread, wind speed), terrain (slope), mitigation (defensible space, firefighting response), and the built environment (materials, design). The challenge is that many of these variables are difficult to observe consistently at global scale. As Dr Sarailidis put it:
The reality is quite messy. The data are really fragmented, and there is limited data availability and accessibility at global scales."
Dr Georgios Sarailidis, Climate X
Climate X’s wildfire loss model focuses on building characteristics that are globally available and materially relevant to damage outcomes. The model uses four characteristics: asset use, roof type, wall type and eaves, to define building archetypes and provides mean damage ratios for each archetype which were estimated from historical post-wildfire damage observations. A building archetype is a combination of structural and material attributes that together characterise a building's likely response to a hazard, in this case, wildfire.
Evaluating a Global Wildfire Model
A detailed regional model can be useful, but global financial institutions need outputs that are consistent across geographies. A lender, insurer or asset manager cannot compare portfolio risk effectively if wildfire probabilities in North America, Europe and APAC are produced using different assumptions, scales or definitions.
You could have the best local model imaginable for a specific region. But if the outputs are not consistent with the rest of the world, then you cannot make a credible prediction on a global portfolio"
Dr Tricia Sullivan, Climate X
Consistency does not mean applying a generic global average. Wildfire behavior is highly local, as vegetation, climate, topography, ignition patterns, built environments and data quality all vary by region. A defensible global wildfire model needs to capture those local differences while ensuring the outputs remain comparable.
That requires a methodology that combines local calibration with global consistency. In practice, this means using regional susceptibility modeling, local statistical assumptions, large stochastic event sets and forward-looking climate projections, so that asset-level burn probability and loss estimates mean the same thing across a global portfolio.
Global Wildfire Validation: Climate X's global wildfire model has undergone extensive testing during development, including backtesting that compares outputs against historical fire and loss datasets such as Global Fire Atlas, California Damage Inspection, PERILS and EM-DAT. The hazard model has been benchmarked against third-party wildfire model outputs. Additional ongoing hazard backtesting is being conducted against the most recent unprecedented wildfires in the 2026 season. Climate X applies a robust Model Risk Management (MRM) framework to its wildfire model, with rigorous testing documentation, providing a strong evidence base for the model's hazard and loss outputs.
For financial institutions, wildfire modeling has to move beyond weather scores and historical fire perimeters. The required output is an asset-level view of annual burn probability and average annual loss, under current and future climate conditions, with assumptions, calibration and uncertainty documented clearly enough for model risk and validation teams to review.
To understand what wildfire risk could mean for your portfolio, contact Climate X.
Next Steps
Wildfire is a growing physical risk, and its impact reaches well beyond insurance, into valuations, exit assumptions, financing terms, and board packs.
Climate X's wildfire model gives banking, asset management, insurance, and private equity teams defensible wildfire risk data and asset-level loss figures.
Whether you're building a wildfire risk assessment process from scratch or pressure-testing your current wildfire modeling software, we'd welcome the conversation.
Wildfire risk modeling: common questions answered.
How are wildfires modeled?
Wildfire models usually simulate risk in stages: ignition, spread across terrain, vegetation and wind, then intensity and damage. Because real-world fire behavior is too complex to capture fully from first principles, operational models are often empirical, physical, or a hybrid of the two. Some combine machine-learning susceptibility mapping with physics-informed spread simulation and stochastic event generation to estimate burn probability and translate it into financial loss.
How accurate are wildfire risk models?
Accuracy depends on what is being measured. Some model components can be calibrated and validated against historical burn patterns using satellite burn-scar data, but the observational record only goes back a few decades, which is short relative to the return periods that matter for infrastructure and mortgage books. That's why credible models often use stochastic simulation to generate a large synthetic event set rather than relying on the historical record alone, and why models used in regulated financial workflows should disclose their validation basis and uncertainty rather than presenting a single accuracy figure.
What's the difference between wildfire hazard and wildfire risk?
Hazard describes the physical event: the probability and characteristics of wildfire at a given location, such as burn probability and fire intensity. Risk goes further, combining that hazard with exposure, which assets are there, and vulnerability, how those assets would be damaged, to estimate financial loss. Two locations can share the same hazard but carry very different risk, depending on what is built there and how it is constructed.
What data is used to model wildfire risk?
Models draw on several layers: satellite-detected burned-area data, such as MODIS-derived products and the Global Fire Atlas, for historical ignition and spread patterns; vegetation, fuel, terrain and weather data for local fire behavior; climate projections, such as CMIP6, for forward-looking conditions; and asset or building characteristics for vulnerability and loss estimation. Because ignition also depends heavily on human activity, land use, infrastructure and population data often factor in as well, particularly in regions where many fires are human-caused.
How far into the future can wildfire models predict?
Forward-looking wildfire risk models can project out to 2100 using climate scenarios such as CMIP6, the same generation of climate projections used in the IPCC's Sixth Assessment Report, run under multiple emissions pathways. These are not forecasts of specific fire events decades in advance. They are a way of conditioning burn probability on how climate drivers, such as vapor pressure deficit, are expected to shift over time, so risk estimates reflect future conditions rather than assuming the past holds steady.
How do wildfire spread models account for climate change?
Forward-looking wildfire models account for climate change by incorporating climate projections such as CMIP6, run under different emissions pathways and time horizons. They can relate variables such as vapor pressure deficit, a measure of atmospheric drying that affects fuel moisture, to changes in burn probability. This lets risk estimates shift by scenario, geography and time horizon, rather than assuming historical fire conditions remain constant. Areas that become hotter and drier typically see rising risk; in some regions, risk may rise more slowly or ease if changes in rainfall, vegetation or fuel conditions offset warming.
What should banks and insurers look for in wildfire modeling software or wildfire insurance software?
- Transparent methodology, validated against relevant observations, such as burn scars, historical fire patterns and observed damage where available.
- Asset-level vulnerability, based on real building characteristics, rather than a uniform damage assumption.
- Decision-useful outputs, metrics that translate directly into underwriting, credit and investment committee language, such as burn probability and average annual loss, rather than only a hazard map or relative score.
Our Latest Articles & News
A selection of some of our latest articles covering industry, policy and climate science - written by us.